ANCOVA code in Python
This article explains how to perform the one-way ANCOVA in Python. You can refer to this article to know more about ANCOVA, when to use ANCOVA, assumptions, and how to interpret the ANCOVA results.
One-way (one factor) ANCOVA in Python
Load the dataset
import pandas as pd
df=pd.read_csv("https://reneshbedre.github.io/assets/posts/ancova/ancova_data.csv")
df.head(2)
  genotype  height  yield
0        A    10.0   20.0
1        A    11.5   22.0
Summary statistics and visualization of dataset
Get summary statistics based on dependent variable and covariate,
from dfply import *
# summary statistics for dependent variable yield
df >> group_by(X.genotype) >> summarize(n=X['yield'].count(), mean=X['yield'].mean(), std=X['yield'].std())
# output
  genotype   n   mean       std
0        A  10  25.17  2.577704
1        B  10  35.45  2.431849
2        C  10  17.73  2.039635

# summary statistics for covariate height
df >> group_by(X.genotype) >> summarize(n=X['height'].count(), mean=X['height'].mean(), std=X['height'].std())
# output
  genotype   n    mean       std
0        A  10  13.790  2.224835
1        B  10  16.756  1.963960
2        C  10   9.600  1.840290
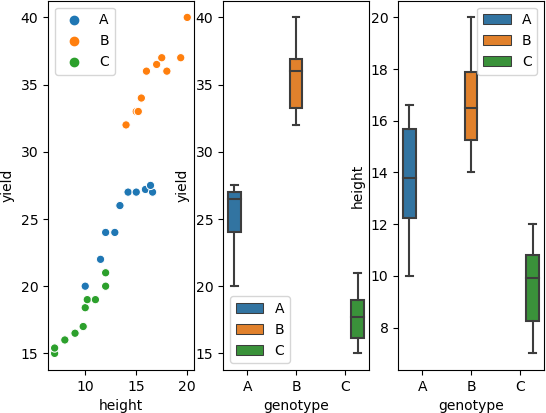
Visualize dataset,
import seaborn as sns
import matplotlib.pyplot as plt
fig, axs = plt.subplots(ncols=3)
sns.scatterplot(data=df, x="height", y="yield", hue=df.genotype.tolist(), ax=axs[0])
sns.boxplot(data=df, x="genotype", y="yield", hue=df.genotype.tolist(), ax=axs[1])
sns.boxplot(data=df, x="genotype", y="height", hue=df.genotype.tolist(), ax=axs[2])
plt.show()

perform one-way ANCOVA
from pingouin import ancova
ancova(data=df, dv='yield', covar='height', between='genotype')
# output
     Source          SS  DF           F         p-unc       np2
0  genotype  193.232458   2  141.352709  1.072947e-14  0.915777
1    height  132.695696   1  194.138152  1.429323e-13  0.881892
2  Residual   17.771304  26         NaN           NaN       NaN
If you have any questions, comments or recommendations, please email me at reneshbe@gmail.com
This work is licensed under a Creative Commons Attribution 4.0 International License

