Brown-Forsythe test for equality of variances in R
What is the Brown-Forsythe test?
- Brown-Forsythe test is used for testing the equality variances (homogeneity of variances) among different groups. It is a robust test when the underlying data does not meet assumptions of normality. Brown-Forsythe test is proposed by Morton Brown and Alan Forsythe in 1974.
- Both Levene’s test and Brown-Forsythe test can be used for testing for homogeneity of variances on nonnormal data. But, the Brown-Forsythe test is more robust than Levene’s test when data distributions are skewed or heavy-tailed (Cauchy distribution). Brown-Forsythe test is a modified version of Levene’s test.
- Levene’s test s based on group means whereas the Brown-Forsythe test is based on group medians or trimmed means.
Brown-Forsythe test hypothesis
- Null hypothesis (H0): Group variances are equal (σ12=σ22=…=σk2)
- Alternative hypothesis (Ha): At least one group variance is not equal (σi2≠σj2)
Learn more about hypothesis testing and interpretation
Calculate Brown-Forsythe test in R
We will use the tidyverse and vGWAS R packages for this tutorial.
Get dataset
Suppose we have four treatment groups (A. B, C, and D) and their plant yield. We would like to check if the variances among the four treatment groups are equal or not. The Homogeneity of variances needs to be checked before performing the ANOVA analysis.
# R version 4.1.2 (2021-11-01)
library(tidyverse)
# load data file
df <- read_csv("https://reneshbedre.github.io/assets/posts/anova/bf_example.csv")
head(df, 2)
# output
 treatment yield
  <chr>     <dbl>
1 A            25
2 A            30
Get variance and visualize the data spread (boxplot)
Calculate variance for each treatment group,
df %>% group_by(treatment) %>% summarise(var = var(yield))

# output
  treatment   var
  <chr>     <dbl>
1 A          16.3
2 B          20.5
3 C          15.2
4 D          27.5
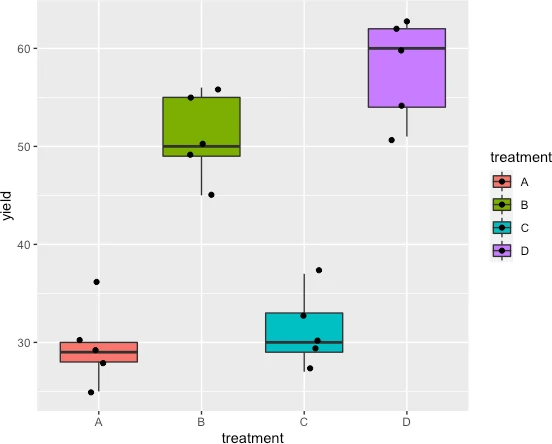
Generate a boxplot to see the data distribution by treatments. Using boxplot, we can easily detect how data is spread for each treatment,
ggplot(df, aes(x = treatment, y = yield, fill = treatment)) +
  geom_boxplot(outlier.shape = NA) + geom_jitter(width = 0.2)
Perform Brown-Forsythe test for equal variance
We will use the brown.forsythe.test function from vGWAS package to perform the Brown-Forsythe test for equal variance
Pass the following parameters to brown.forsythe.test function,
- y : a numeric vector of the dependent variable
- group : Groups (independent variable)
library(vGWAS)
brown.forsythe.test(y = df$yield, group = df$treatment)

# output

	Brown-Forsythe test based on the absolute deviations from the
	median

data:  df$yield
Test Statistic = 0.22663, p-value = 0.8765
The Brown-Forsythe test results indicate that variances are not significantly different [W = 0.22, p = 0.87] among the groups. Hence, we fail to reject the null hypothesis (as p > 0.05) that group variances are equal. As the group variances are not different, the Homogeneity of variance assumption for the one-way ANOVA test is valid.
Note: Brown-Forsythe test for equality of variances is different than the Brown-Forsythe test for equality of means. The later test can be performed using the
bf.testfunction from theonewaytestspackage.
Enhance your skills with statistical courses using R
References
- Brown MB, Forsythe AB. Robust tests for the equality of variances. Journal of the American Statistical Association. 1974 Jun 1;69(346):364-7.
- Levene Test for Equality of Variances
- Tests for Homogeneity of Variance
If you have any questions, comments, corrections, or recommendations, please email me at reneshbe@gmail.com
This work is licensed under a Creative Commons Attribution 4.0 International License
Some of the links on this page may be affiliate links, which means we may get an affiliate commission on a valid purchase. The retailer will pay the commission at no additional cost to you.

