Calculate Quartiles in R
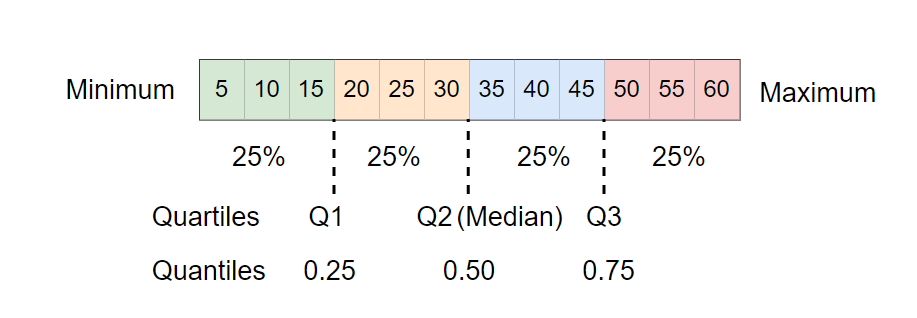
Quartiles are values which divide a dataset into four equal parts, each of which contains 25% of the data. It is helpful to understand the spread and distribution of a dataset by using quartiles.
In general, there are three quartiles (Q1, Q2, and Q3) used. Q1 (first quartile), Q2 (second quartile), and Q3 (third quartile) are the values below which 25%, 50%, and 75% of the data fall.
In R, the quartiles can be calculated using the built-in quantile()
function.
The general syntax of quantile() looks like this:
# calculate quartiles
quantile(x)
Where, x is a vector of the dataset.
The following three examples explains how to use the quantile() function from R to calculate quartiles from vector and
data frame.
Example 1:
Suppose, you have a following dataset for which you would like to calculate the quartiles,
x = c(48, 64 ,43, 62, 56, 52, 80, 63, 68, 82)
Calculate the quartiles using quantile() function,
quantile(x)
# output
  0%  25%  50%  75% 100%
43.0 53.0 62.5 67.0 82.0
From the output, you can see that Q1, Q2, and Q3 quartile values are 53, 62.5, and 67, respectively.
Example 2:
Suppose, you have a dataset in a data frame format.
# create random pandas DataFrame
df < -data.frame(col1 = c('A', 'B', 'C', 'D', 'E', 'F', 'G', 'H', 'I', 'J'),
                 col2 = c(48, 64 ,43, 62, 56, 52, 80, 63, 68, 82))

# view first few rows
head(df, 2)
  col1 col2
1    A   48
2    B   64

# calculate quartiles
quantile(df$col2)

# output
  0%  25%  50%  75% 100%
43.0 53.0 62.5 67.0 82.0
From the output, you can see that Q1, Q2, and Q3 quartile values are 53, 62.5, and 67, respectively.
Example 3:
You can also visualize the quartiles using the boxplot. The boxplot helps to visualize the spread and distribution of the data.
Create a boxplot,
x = c(48, 64 ,43, 62, 56, 52, 80, 63, 68, 82)

# boxplot
boxplot(x)
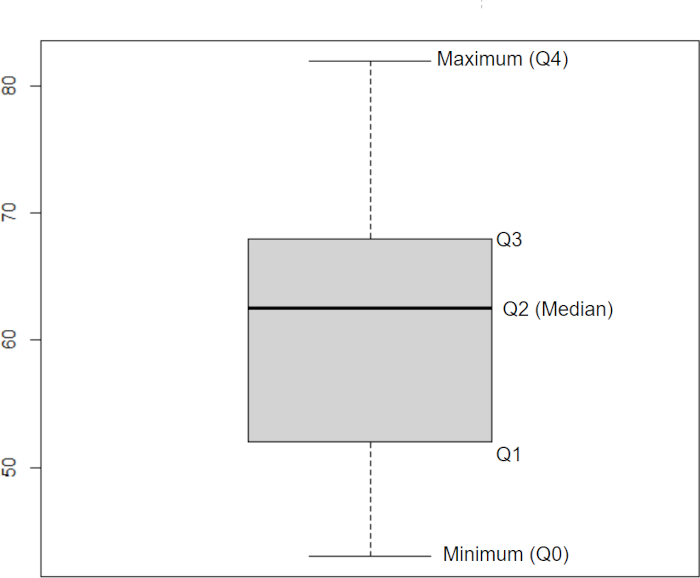
Using the boxplot, we can estimate the quartile locations.
Minimum value or Q0 (43) is indicated by the bottom whisker, Q1 (53) is indicated by the bottom line of box, median value or Q2 (62.5) is indicated by the middle dark line, and maximum value or Q4 (82) is indicated by the top whisker.
Related: Calculate quartiles in Python
Enhance your skills with courses on Statistics and R
- Introduction to Statistics
- R Programming
- Data Science: Foundations using R Specialization
- Data Analysis with R Specialization
- Getting Started with Rstudio
- Applied Data Science with R Specialization
- Statistical Analysis with R for Public Health Specialization
This work is licensed under a Creative Commons Attribution 4.0 International License
Some of the links on this page may be affiliate links, which means we may get an affiliate commission on a valid purchase. The retailer will pay the commission at no additional cost to you.

