How to calculate correlation between two variables in R
What is Correlation?
- Correlation is a statistical method to measure the relationship between the two quantitative variables in terms of
correlation coefficient (
r). - The correlation coefficient (
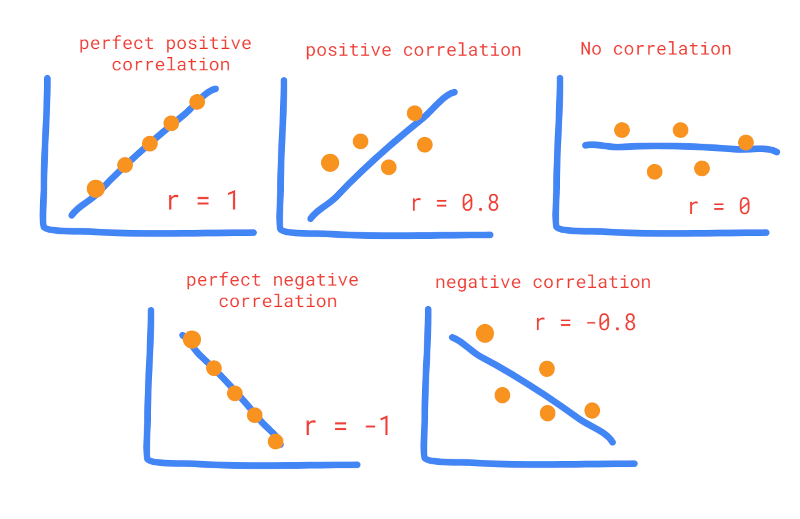
r) measures the strength and direction of (linear) relationship between the two quantitative variables.rcan range from +1 (perfect positive correlation) to -1 (perfect negative correlation). - The positive values of
rindicate the positive relationship and vice versa. The higher the absolute value ofr, the stronger is the correlation. If the value ofris 0, it indicates that there is no relationship between the two variables.
Interpretation of correlation coefficient (r)
The below table suggests the interpretation of r at different absolute values. These cut-off are arbitrary
and should be used judiciously while interpreting the dataset.
absolute values of r |
Interpretation |
|---|---|
| 0.90 - 1.00 | Very high correlation |
| 0.70 - 0.90 | High correlation |
| 0.50 - 0.70 | Moderate correlation |
| 0.30 - 0.50 | Low correlation |
| 0 - 0.30 | Negligible or weak correlation |
Note: In interpretation, correlation can be positive or negative based on the sign of r
Types of correlation coefficients (r)
There are three main types of correlation coefficients including, Pearson’s product-moment correlation coefficient, Spearman’s rank-order (Spearman’s rho) correlation coefficient, and Kendall’s Tau correlation coefficient.
Most of the times correlation coefficients is referred to Pearson’s r unless specified.
Note: The appropriate usage of different types of correlation coefficients largely depends on underlying data types, sample size, linear or non-linear relationships between the two variables, and their distributions.
Pearson’s product-moment correlation coefficient
Pearson’s correlation coefficient (r) is a commonly used method for measuring the relationship between the two variables. Measurement of both variables should be on a continuous scale and they should have a normal distribution. There should be no extreme outlier in the dataset.
Pearson’s correlation coefficient (r) may inflate type I error rate if data is markedly non-normally distributed and has an extreme outlier.
Pearson’s correlation coefficient (r) more useful when there is linear relationship between the two variables.
Note: If the relationship is not linear and both variables significantly deviate from a normal distribution, it is better to use rank-based correlation coefficients (Spearman’s or Kendall’s r). The alternate way is to perform data transformations (e.g. logarithmic, square root, etc.,) before calculating Pearson’s r.
Suppose, we have x and y variables, the Pearson’s correlation coefficient (r) is calcualted as,
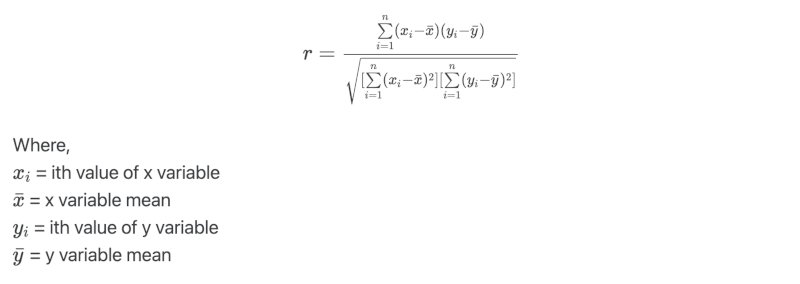
Calculate Pearson’s correlation coefficient in R for students height and weight data,
# load dataset
library(tidyverse)
df <- read.csv("https://reneshbedre.github.io/assets/posts/reg/height.csv")
# view first two rows
head(df, 2)
  Height Weight
1   1.36     52
2   1.47     50
Check assumptions of normality for both height and weight variables using Shapiro-Wilk test,
shapiro.test(df$Height)$p
[1] 0.977633

shapiro.test(df$Weight)$p
[1] 0.9423351
As the p > 0.05 for both height and weight variables, we fail to reject null hypothesis and conclude that both variables are approximately normally distributed. We can use Pearson’s method for finding the correlation coefficient.
Calculate Pearson’s correlation coefficient (r),
# calculate Pearson's correlation coefficient
cor.test(df$Height, df$Weight, method = "pearson")
# output
	Pearsons product-moment correlation

data:  df$Height and df$Weight
t = 2.5132, df = 9, p-value = 0.03313
alternative hypothesis: true correlation is not equal to 0
95 percent confidence interval:
 0.06881088 0.89664256
sample estimates:
      cor
0.6421781

# plot
library(ggstatsplot)
ggscatterstats(data = df, x = Height, y = Weight)
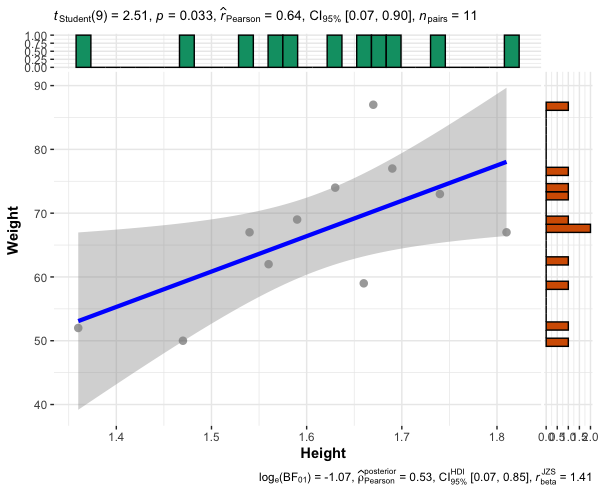
The Pearson’s r between height and weight is 0.64 (height and weight of students are moderately correlated). As the p < 0.05, the correlation is statistically significant.
Spearman’s rank-order (Spearman’s rho) correlation coefficient
Spearman’s correlation coefficient is appropriate when one or both of the variables are ordinal or continuous. It is a non-parametric method and is based on the rank instead of the actual values of the variables.
Spearman’s correlation coefficient is robust to extreme outliers. When the data is not normally distributed, Spearman’s correlation coefficient has more power than Pearson’s correlation coefficient.
Spearman’s correlation coefficient is more useful when there is nonlinear or monotonic relationship between the two variables.
If sample size is large, Spearman’s correlation coefficient is preferred over Kendall’s correlation coefficient.
Suppose, we have x and y variables, the Spearman’s rank-order correlation coefficient for no tied rank is calculated
as,
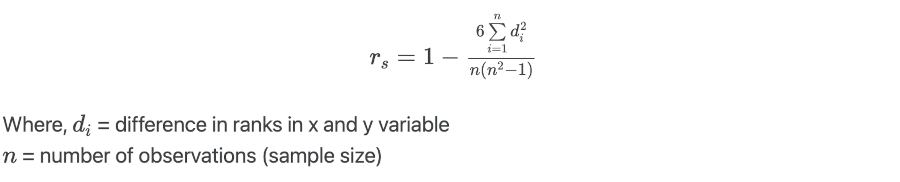
Calculate Spearman’s rank-order correlation coefficient in R,
# We will use the same dataset as used for Pearson's correlation coefficient
cor.test(df$Height, df$Weight, method = "spearman")
# output
Spearmans rank correlation rho
data: df$Height and df$Weight
S = 81.685, p-value = 0.03827
alternative hypothesis: true rho is not equal to 0
sample estimates:
rho
0.6287032
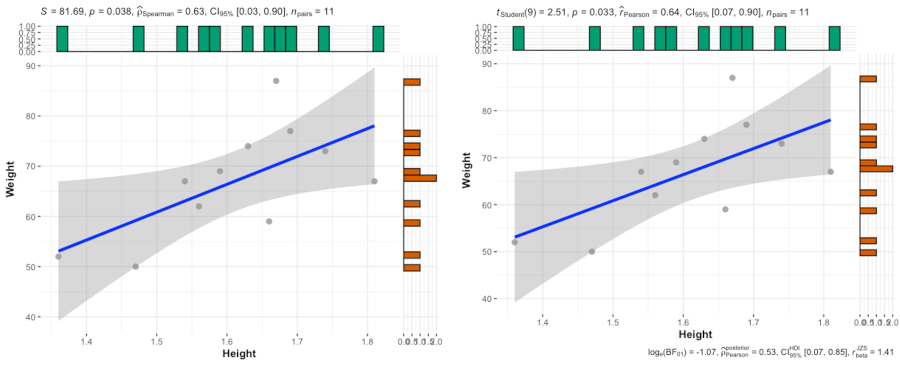
# plot
ggscatterstats(data = df, x = Height, y = Weight, type = "nonparametric")
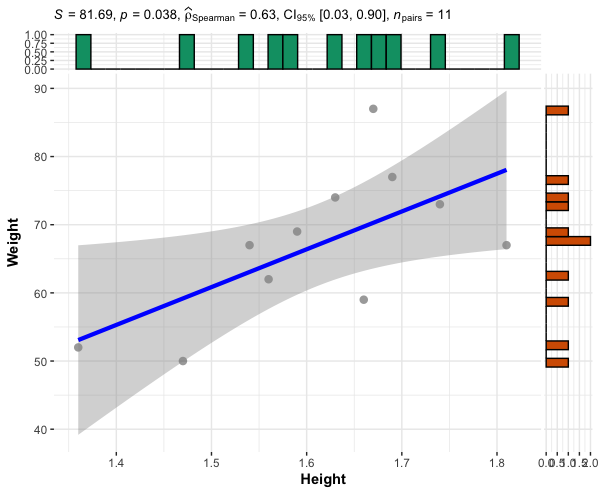
The Spearman’s rank-order correlation coefficient between height and weight is 0.62 (height and weight of students are moderately correlated). As the p < 0.05, the correlation is statistically significant.
Kendall’s Tau (Kendall rank) correlation coefficient
Kendall’s Tau (τ) is a non-parametric rank-based method for calculating the correlation between two variables (ordinal or continuous).
Kendall’s Tau is more useful when there is a nonlinear or monotonic relationship between the two variables.

Where concor = number of concordant pairs; and discor = number of discordant pairs
Calculate Kendall’s Tau correlation coefficient in R,
# We will use the same dataset as used for Pearson's correlation coefficient
cor.test(df$Height, df$Weight, method = "kendall")
# output
	Kendalls rank correlation tau

data:  df$Height and df$Weight
z = 1.8741, p-value = 0.06092
alternative hypothesis: true tau is not equal to 0
sample estimates:
      tau
0.4403855
The Kendall’s Tau correlation coefficient between height and weight is 0.44. As the p > 0.05, the correlation is not statistically significant.
Enhance your skills with statistical courses using R
- Statistics with R Specialization
- Data Science: Foundations using R Specialization
- Data Analysis with R Specialization
- R Programming
- Getting Started with Rstudio
Related reading
References
- Bishara AJ, Hittner JB. Testing the significance of a correlation with nonnormal data: comparison of Pearson, Spearman, transformation, and resampling approaches. Psychological methods. 2012 Sep;17(3):399.
- Puth MT, Neuhäuser M, Ruxton GD. Effective use of Spearman’s and Kendall’s correlation coefficients for association between two measured traits. Animal Behaviour. 2015 Apr 1;102:77-84.
- Mukaka MM. A guide to appropriate use of correlation coefficient in medical research. Malawi medical journal. 2012;24(3):69-71.
- Gust L, D’journo XB. The use of correlation functions in thoracic surgery research. Journal of thoracic disease. 2015 Mar;7(3):E11.
- Simple Linear Regression: Finding the equation of the line of best fit
If you have any questions, comments, corrections, or recommendations, please email me at reneshbe@gmail.com
This work is licensed under a Creative Commons Attribution 4.0 International License
Some of the links on this page may be affiliate links, which means we may get an affiliate commission on a valid purchase. The retailer will pay the commission at no additional cost to you.

