How to Get F Statistics and p Value From lm in R

In R, the summary() function provides detailed summary results of the fitted regression model obtained from the
lm() function.
Sometimes, we are interested in only getting F statistics and p value from the fitted model instead of getting detailed summary statistics.
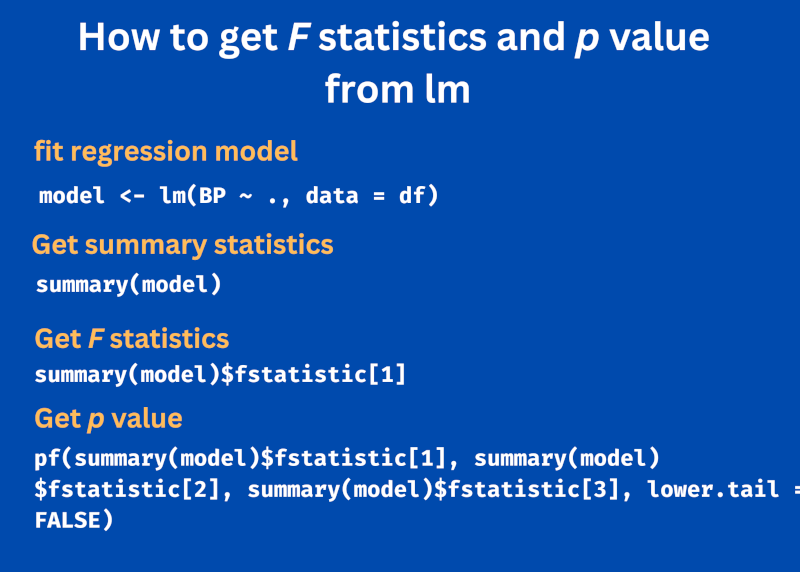
You can use the following syntax to get F statistics and p value from lm summary statistics,
# F statistic
summary(model)$fstatistic[1]

# p value
pf(summary(model)$fstatistic[1], summary(model)$fstatistic[2], summary(model)$fstatistic[3], lower.tail = FALSE)
The multiple regression example below illustrates how to get the F statistics and p value based on the fitted model.
Load blood pressure example dataset to fit the regression model,
df = read.csv("https://reneshbedre.github.io/assets/posts/reg/bp.csv")

# view first 5 rows
head(df)
   BP Age Weight  BSA Dur Pulse Stress
1 105  47   85.4 1.75 5.1    63     33
2 115  49   94.2 2.10 3.8    70     14
3 116  49   95.3 1.98 8.2    72     10
4 117  50   94.7 2.01 5.8    73     99
5 112  51   89.4 1.89 7.0    72     95
6 121  48   99.5 2.25 9.3    71     10
Fit the multiple regression model using the lm() function with BP as a dependent variable,
model <- lm(BP ~ ., data = df)

# summary statistics
summary(model)

# output
Call:
lm(formula = BP ~ ., data = df)

Residuals:
     Min       1Q   Median       3Q      Max
-0.93213 -0.11314  0.03064  0.21834  0.48454

Coefficients:
              Estimate Std. Error t value Pr(>|t|)
(Intercept) -12.870476   2.556650  -5.034 0.000229 ***
Age           0.703259   0.049606  14.177 2.76e-09 ***
Weight        0.969920   0.063108  15.369 1.02e-09 ***
BSA           3.776491   1.580151   2.390 0.032694 *
Dur           0.068383   0.048441   1.412 0.181534
Pulse        -0.084485   0.051609  -1.637 0.125594
Stress        0.005572   0.003412   1.633 0.126491
---
Signif. codes:  0 ‘***’ 0.001 ‘**’ 0.01 ‘*’ 0.05 ‘.’ 0.1 ‘ ’ 1

Residual standard error: 0.4072 on 13 degrees of freedom
Multiple R-squared:  0.9962,	Adjusted R-squared:  0.9944
F-statistic: 560.6 on 6 and 13 DF,  p-value: 6.395e-15
The summary statistics provide values of F statistics (560.6) and p value (6.395e-15) along with other regression model statistics such as regression coefficients and residuals.
F statistics and p value are used to assess the significant relationship between the independent variables and dependent variable. The significant p value (p < 0.05) indicates statistically significant relationship and suggests independent variables reliably predict the dependent variable.
If you only want to get F statistics and p value from summary statistics, you can extract those values as below,
Extract F statistics,
summary(model)$fstatistic[1]
  value
560.641
The summary() function does not explicitly return the p value. But p value can be calculated using F statistics
and degrees of freedom.
pf(summary(model)$fstatistic[1], summary(model)$fstatistic[2], summary(model)$fstatistic[3], lower.tail = FALSE)
      value
6.395226e-15
In the above code, summary(model)$fstatistic[2] and summary(model)$fstatistic[3] return the numerator and denominator
degree of freedoms, respectively.
The lower.tail is set to FALSE for getting the right-sided probability of the F distribution
Enhance your skills with statistical courses using R
- Statistics with R Specialization
- Data Science: Foundations using R Specialization
- Data Analysis with R Specialization
- Understanding Clinical Research: Behind the Statistics
- Introduction to Statistics
- R Programming
- Getting Started with Rstudio
This work is licensed under a Creative Commons Attribution 4.0 International License
Some of the links on this page may be affiliate links, which means we may get an affiliate commission on a valid purchase. The retailer will pay the commission at no additional cost to you.

