How to Calculate p Value by Hand
What is p value?
Probability (p) value is used for quantifying the statistical significance of obtained results in hypothesis testing.
p value range from 0 to 1, and represents the probability of obtaining the extreme results than actual results when the null hypothesis is true. The lower the p value, it is very unlikely to obtain such extreme results when the null hypothesis is true.
When the p value obtained from statistical analysis is less than 0.05 (5%), the null hypothesis is rejected. The 0.05 (5%) significance cut-off (α level) is considered as standard in hypothesis testing.
How to calculate p value for t test by hand (using t table)?
To understand how p value is calculated in a statistical test (two-tailed and one-tailed), we will use the example of one-sample t test.
Example: a ball has a diameter of 5 cm and we want to check whether the mean diameter of the ball from the random sample (11 balls) picked from the production line differs from the known size. The mean and standard deviation of the balls are 6.58 cm and 1.12, respectively.
Steps involved in the calculation of test statistics and p value,
1. Provide Null and alternative hypotheses (Two-tailed and one-tailed)
Two-tailed hypotheses,
Null hypothesis : Sample mean is equal to the known population mean (H0 = µ = 5)
alternative hypothesis (two-tailed): Sample mean is not equal to known population mean (Ha = µ ≠ 5)
One-tailed hypotheses,
Alternative hypothesis (one-tailed or right-sided): Sample mean is greater than the known population mean (Ha = µ > 5)
Alternative hypothesis (one-tailed or left-sided): Sample mean is lesser than the known population mean (Ha = µ < 5)
2. Calculate test statistic (t value) and degree of freedoms using one-sample t test formula

Degrees of freedom = n-1 = 11-1 = 10
The example dataset gives test statistics (t value) of 4.44 with 10 degrees of freedom.
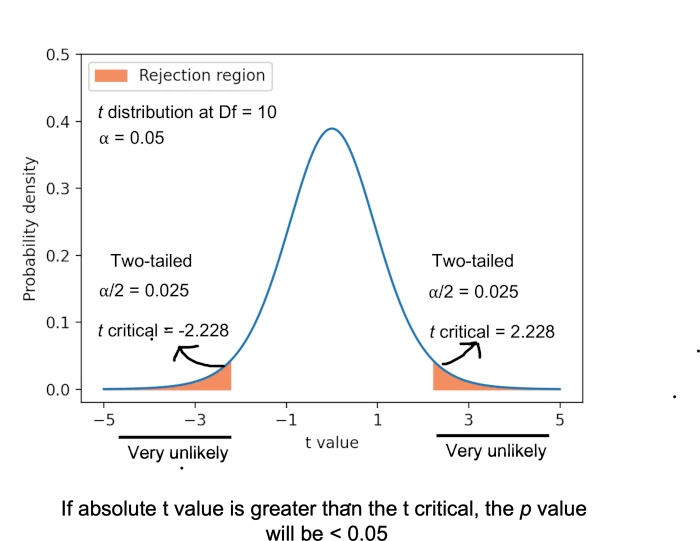
3. Compare the t value to t distribution (t table) and calculate the p value
t value (test statistics) obtained from the one-sample t test is compared with the t critical value (theoretical value from t table with a given degrees of freedoms and significance level, α level). Generally, the significance level (α) is set at 0.05.
For a two-tailed test (test for differences in both directions), if the absolute t value is greater than the t critical value, we reject the null hypothesis in favor of the alternative hypothesis. For this example, the t value is 4.44, and the t critical value is 2.228 (check at t table with degrees of freedom 10 and α = 0.05 for two-tailed test). As the absolute t value is greater than the t critical (2.228), we reject the null hypothesis (as p < 0.05) in favor of the alternative hypotheses.
To calculate p value from t table, look at a row with degrees of freedom is 10 and find for t value (4.44). As the t value lies between 4.144 and 4.587, the two-tailed p value for test statistics would be between 0.001 to 0.002. The exact p value is 0.0012 (computationally calculated, check here).
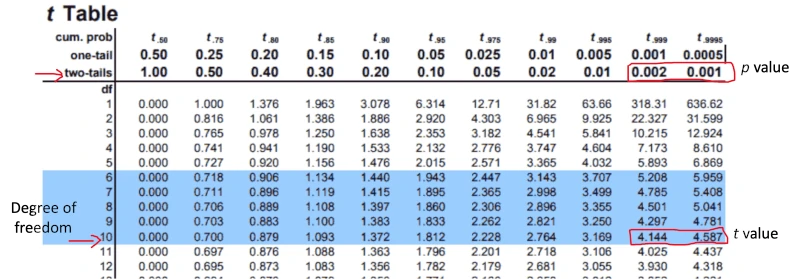
Source: https://www.tdistributiontable.com/
Note: As the t distribution is symmetric about zero, the probability of getting the value of 4.44 or greater is the same as the probability of getting the value of -4.44 or lesser. In the t table, there are only positive t critical values are provided.
For a one-tailed, right-sided test (test for differences in one direction), if the t value is greater than the t critical value, we reject the null hypothesis in favor of the alternative hypothesis. For this example, the t value is 4.44, and the t critical value is 1.812 (check at t table with degrees of freedom 10 and α = 0.05 for one-tailed test). As the t value (4.44) is greater than the t critical (1.812) , we reject the null hypothesis in favor of alternative hypothesis.
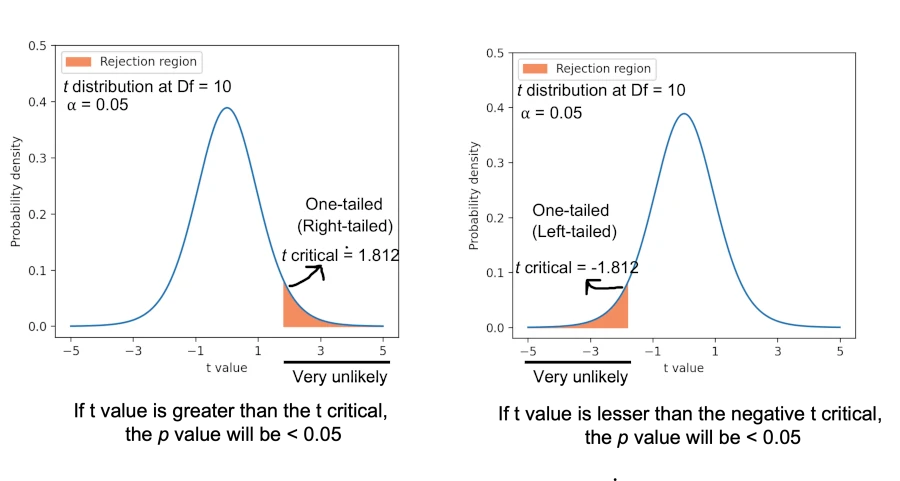
To calculate the p value from the t table, look at the row with degrees of freedom is 10 and find for the t value (4.44). As t value lies between 4.144 and 4.587, the one-tailed (right-sided) p value for test statistics would be between 0.0005 to 0.001. The exact p value is 0.00062 (computationally calculated, check here).
Source: https://www.tdistributiontable.com/
The p value of the one-tailed (right or left) hypothesis can also be obtained as 0.5*(two-tailed p value) or 1-0.5*(two-tailed p value) depending on the direction of the one-tailed hypothesis
Enhance your skills with courses on Statistics and Python
- Introduction to Statistics
- Understanding Clinical Research: Behind the Statistics
- Statistics with R Specialization
- Data Science: Foundations using R Specialization
References
- Nahm FS. What the P values really tell us. The Korean journal of pain. 2017 Oct;30(4):241.
- Andrade C. The P value and statistical significance: misunderstandings, explanations, challenges, and alternatives. Indian journal of psychological medicine. 2019 May;41(3):210-5.
If you have any questions, comments, corrections, or recommendations, please email me at reneshbe@gmail.com
This work is licensed under a Creative Commons Attribution 4.0 International License

