Manhattan plot in Python
What is Manhattan plot?
- Manhattan plot used to visualize the association of SNPs with given trait or disease as statistical significance in terms of p values on a genomic scale.
- In the Manhattan plot, X- and Y-axis represents the SNPs on the chromosomes and associated p values as −log10[p].
- It is a good way to visualize thousands to millions of SNPs o genome-scale. The lowest the p value (higher −log10[p]), highest is the association of a given SNP with trait or disease.
- Manhattan plot can also used for visualizing the SNP markers with Fst values (measures for genetic differentiation).
How to create Manhattan plot in Python?
- We will use
bioinfokit v2.0.1or later - Check bioinfokit documentation for installation and documentation (check how to install Python packages)
- For generating Manhattan plot, I have used simulated GWAS data for 20K SNPs distributed over 10 chromosomes. Here’s you can download GWAS dataset used for generating Manhattan plot: dataset
Note: If you have your own dataset, you should import it as pandas dataframe. Learn how to import data using pandas
from bioinfokit import analys, visuz
# load dataset as pandas dataframe
df = analys.get_data('mhat').data
df.head(2)
   SNP    pvalue  chr
0  rs0  0.773739    3
1  rs1  0.554637    6

# create Manhattan plot with default parameters
visuz.marker.mhat(df=df, chr='chr',pv='pvalue')
# set parameter show=True, if you want view the image instead of saving
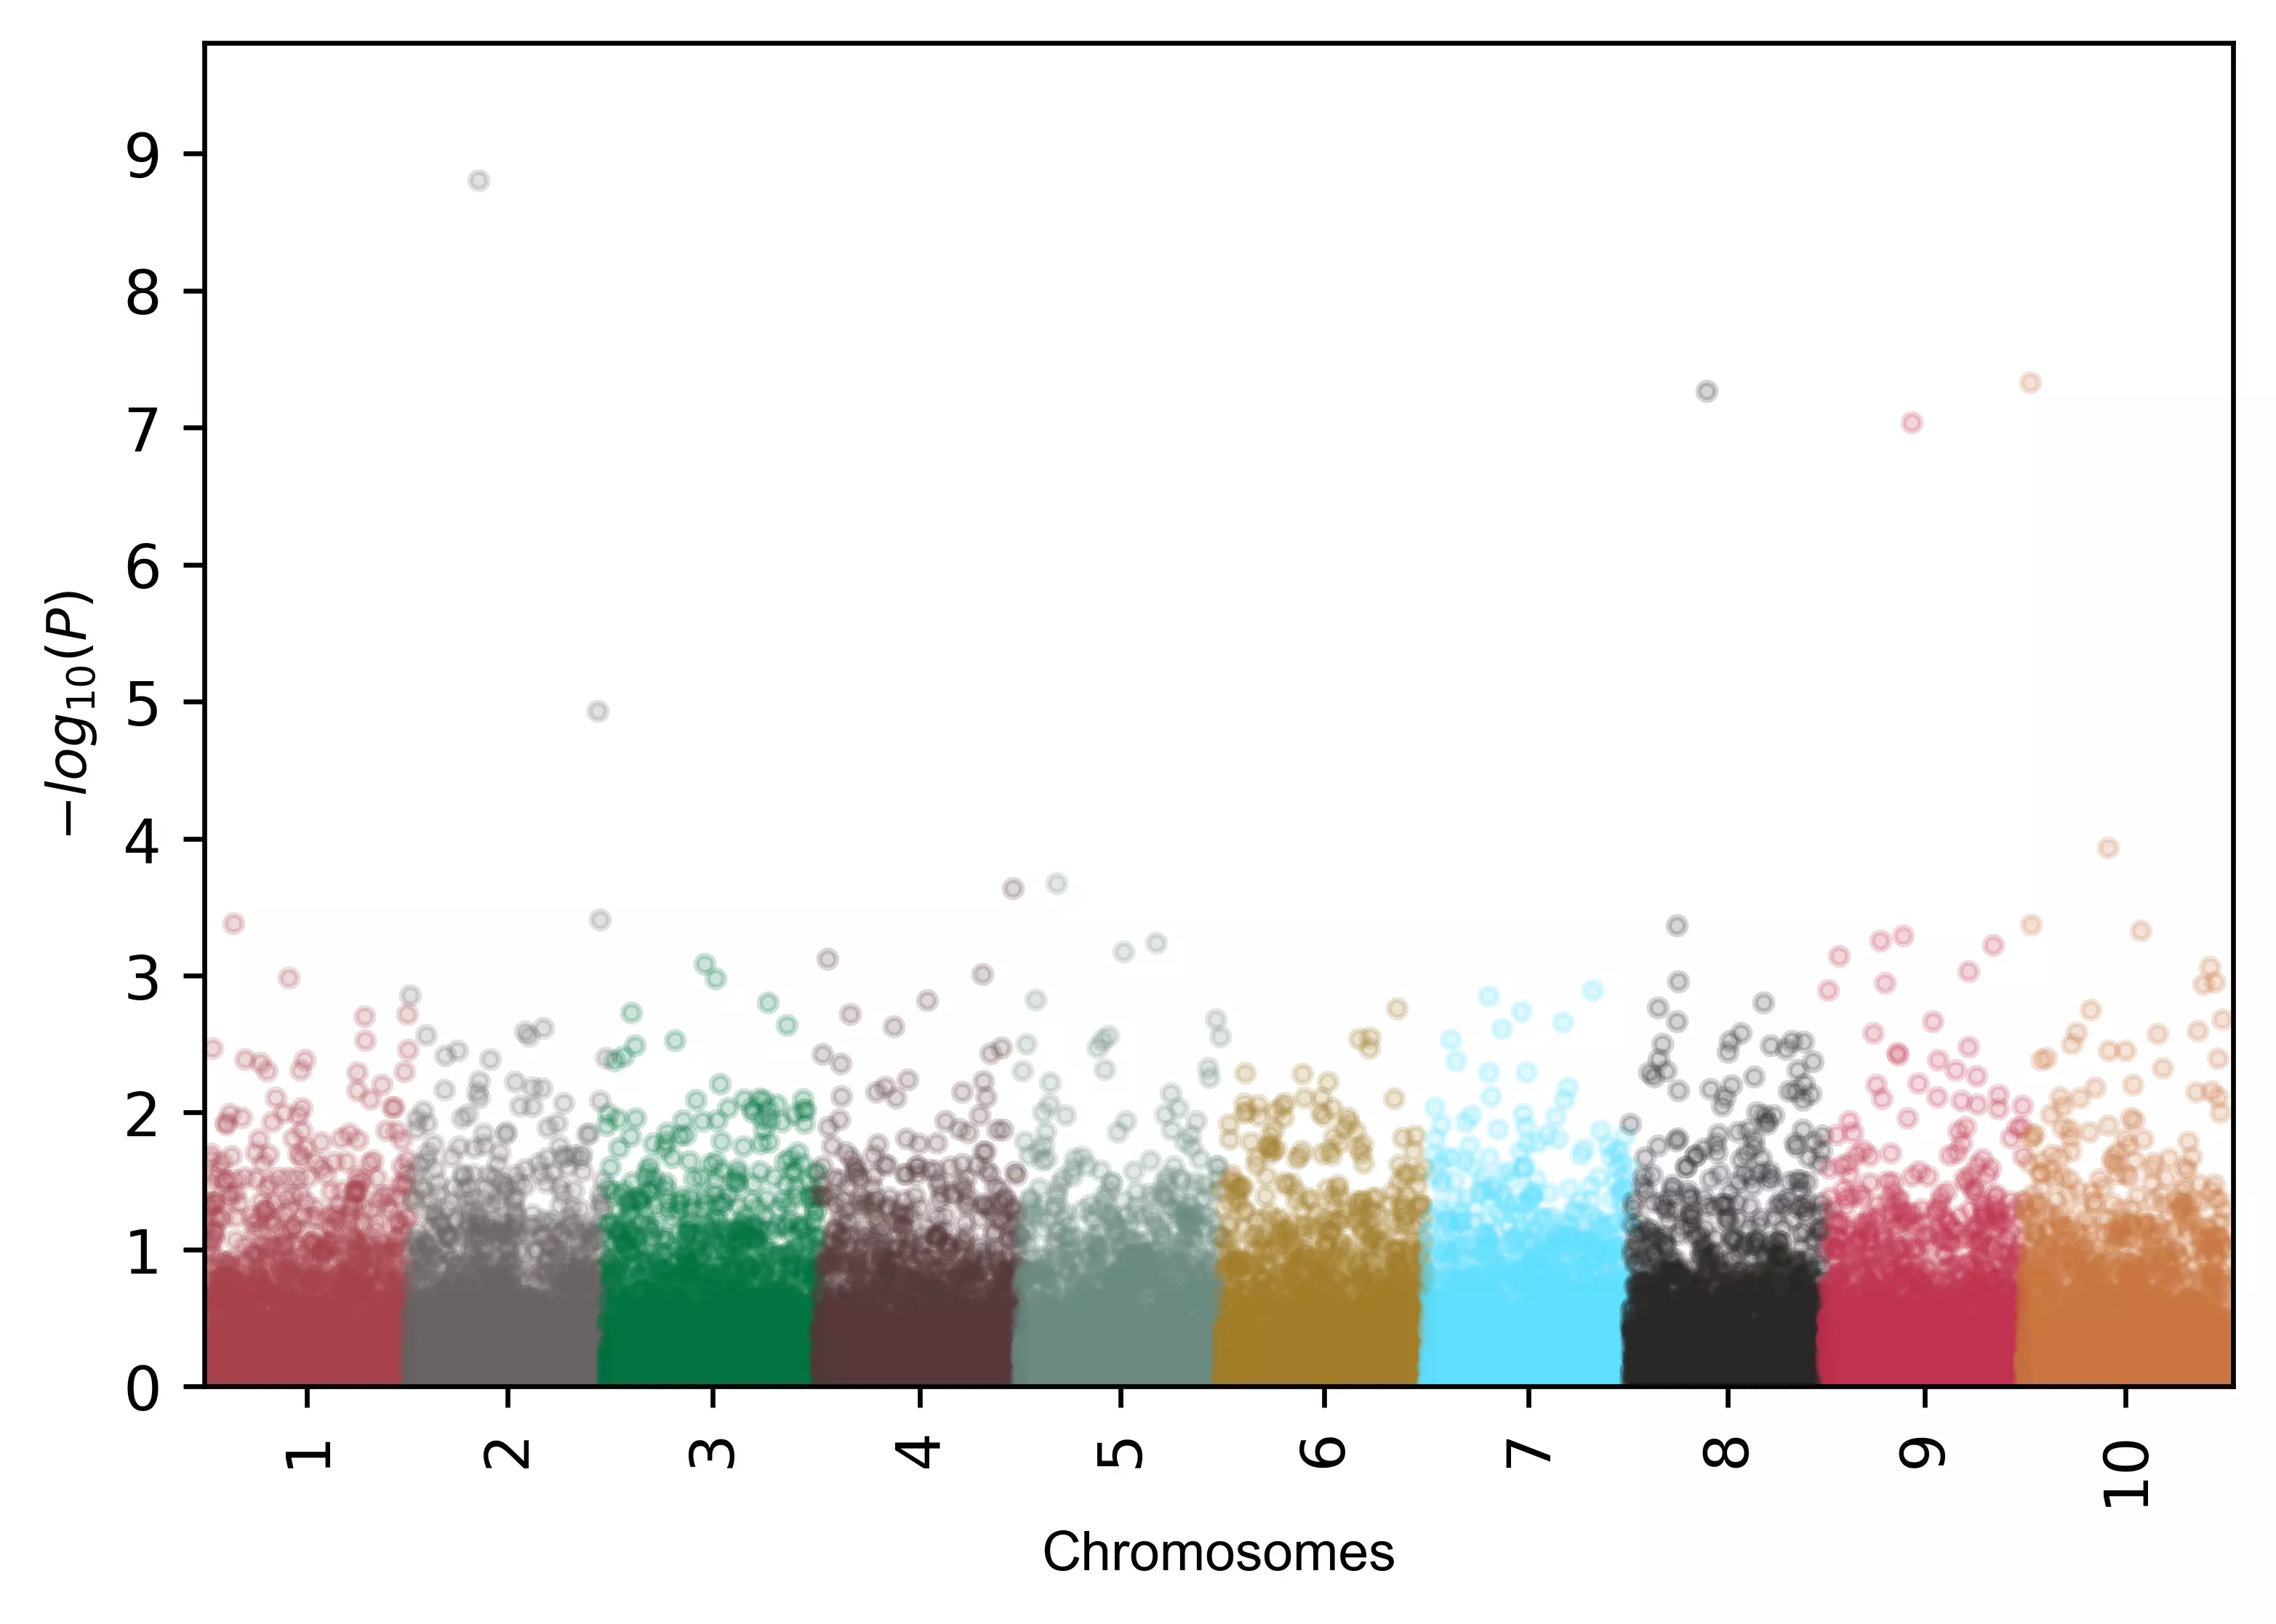
Generated Manhattan plot,
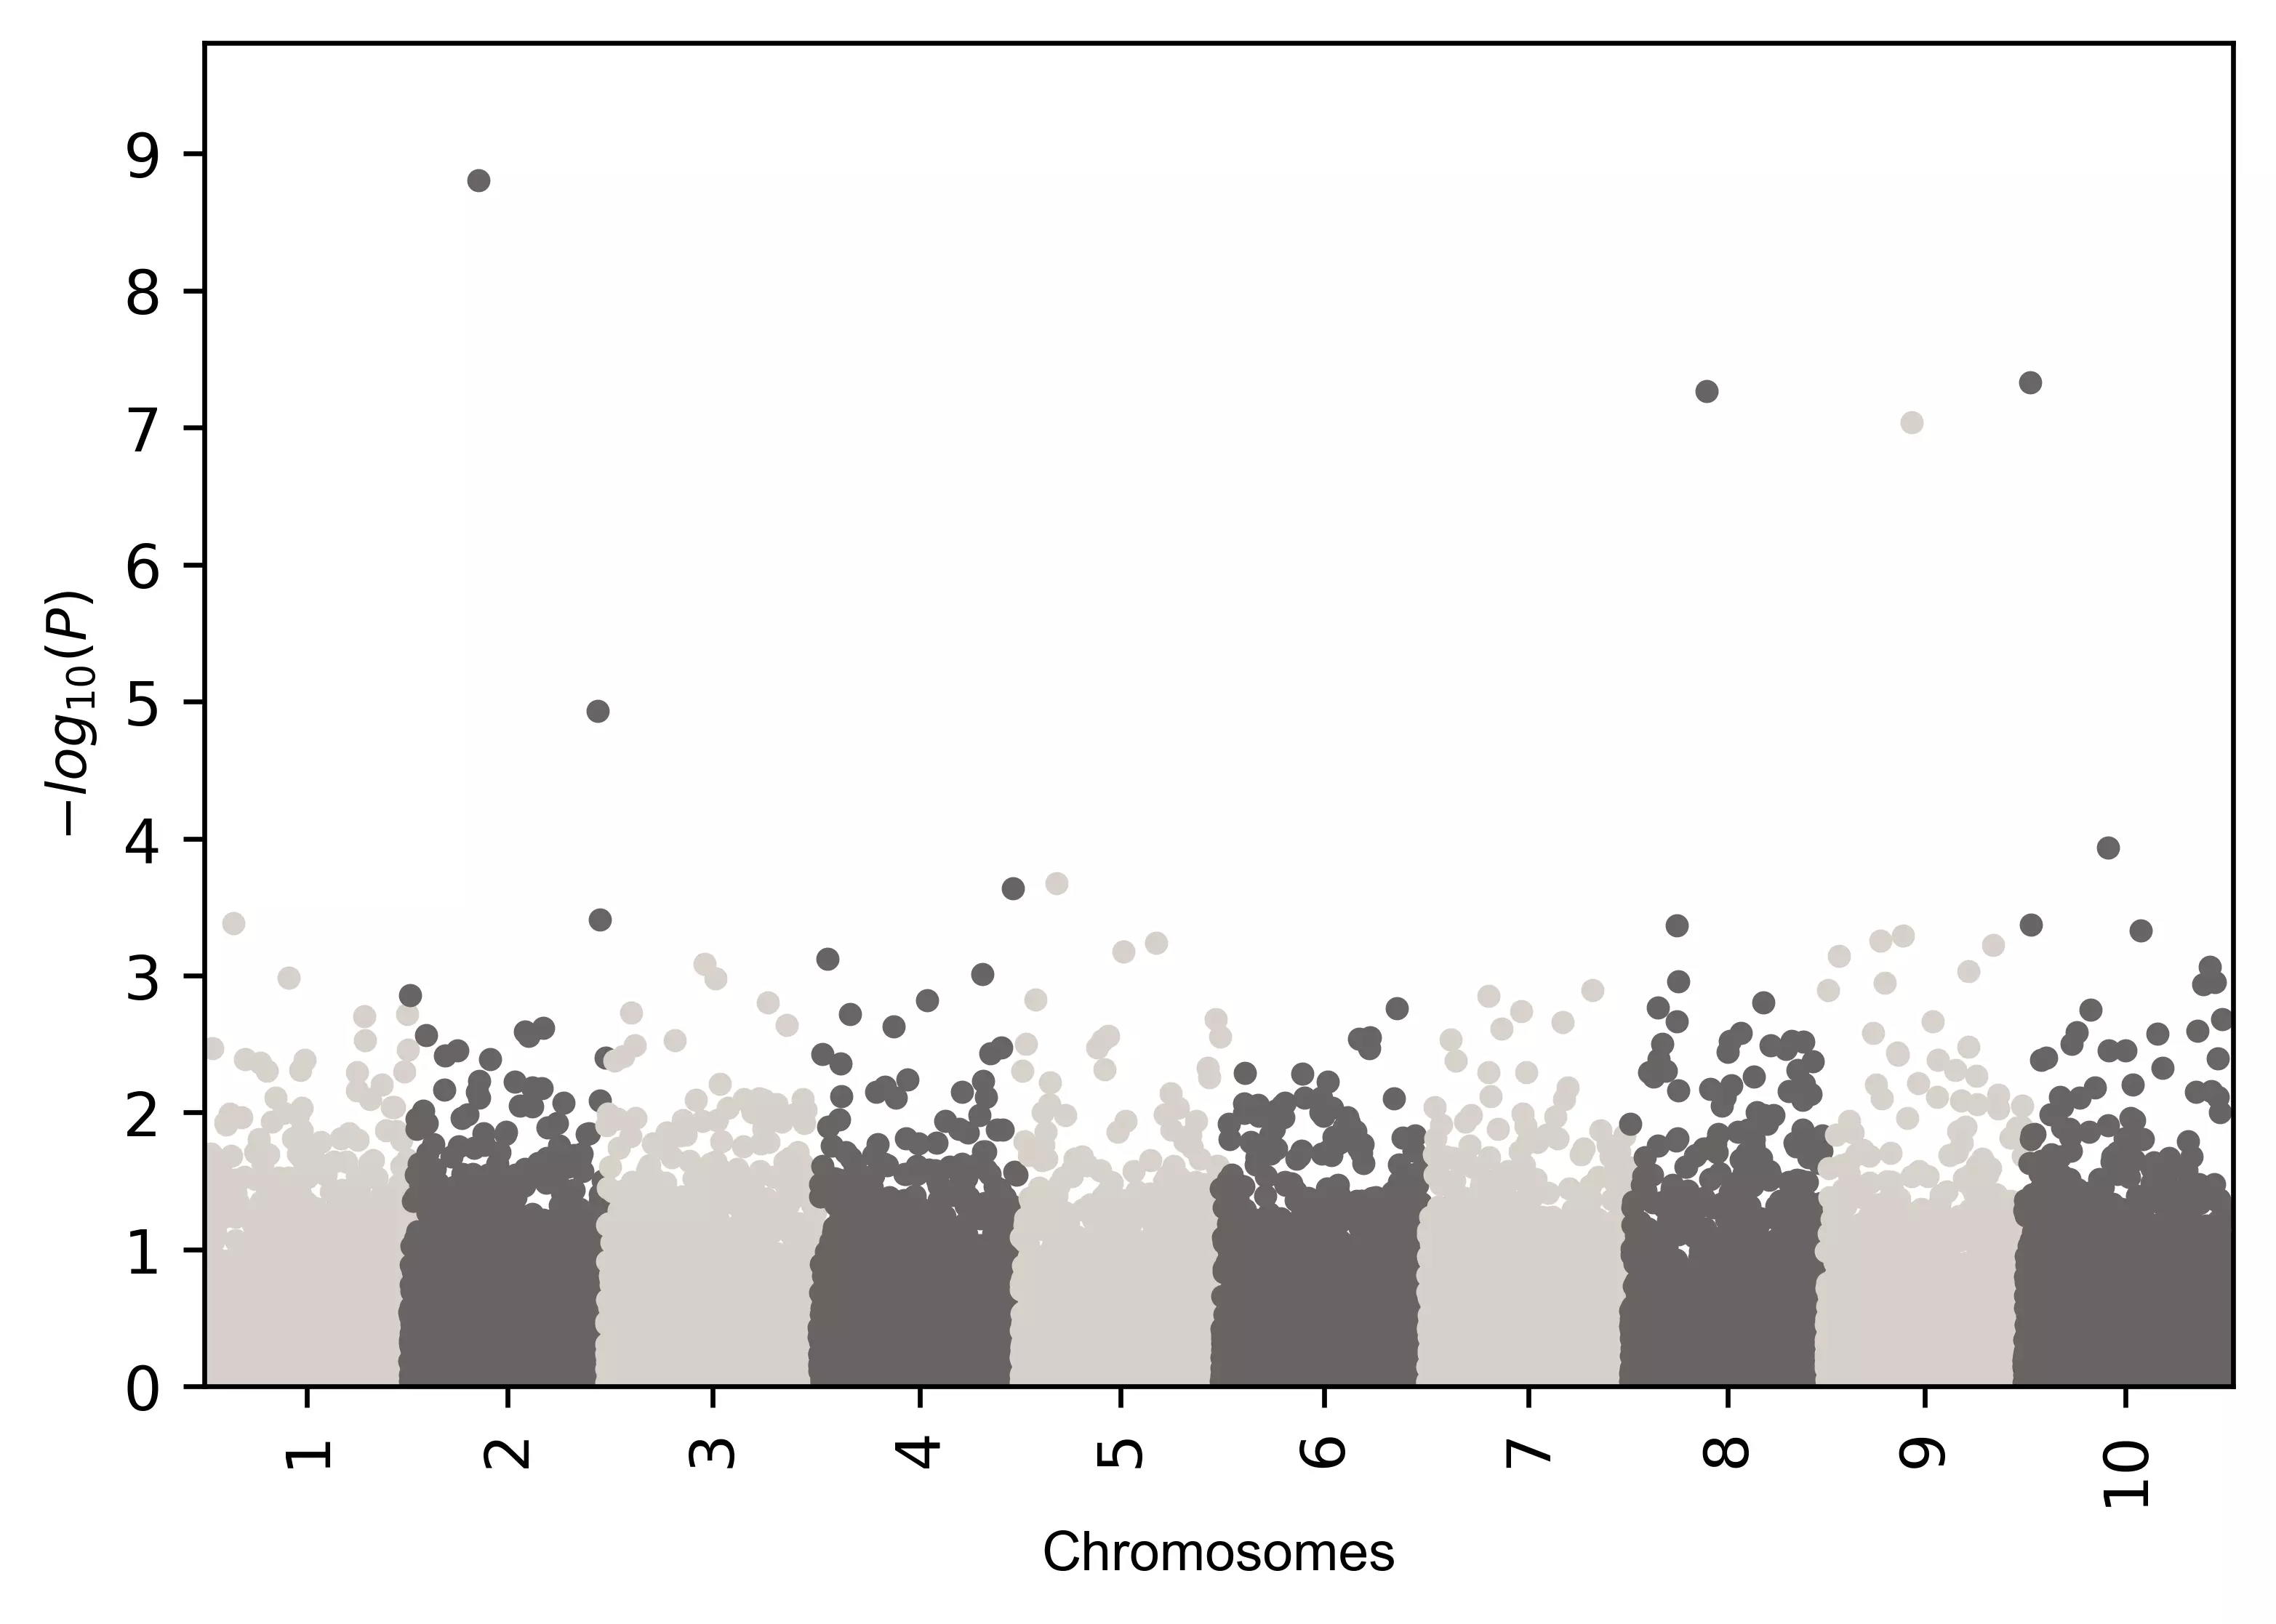
Change colors
# add alternate two colors
visuz.marker.mhat(df=df, chr='chr',pv='pvalue', color=("#d7d1c9", "#696464"))
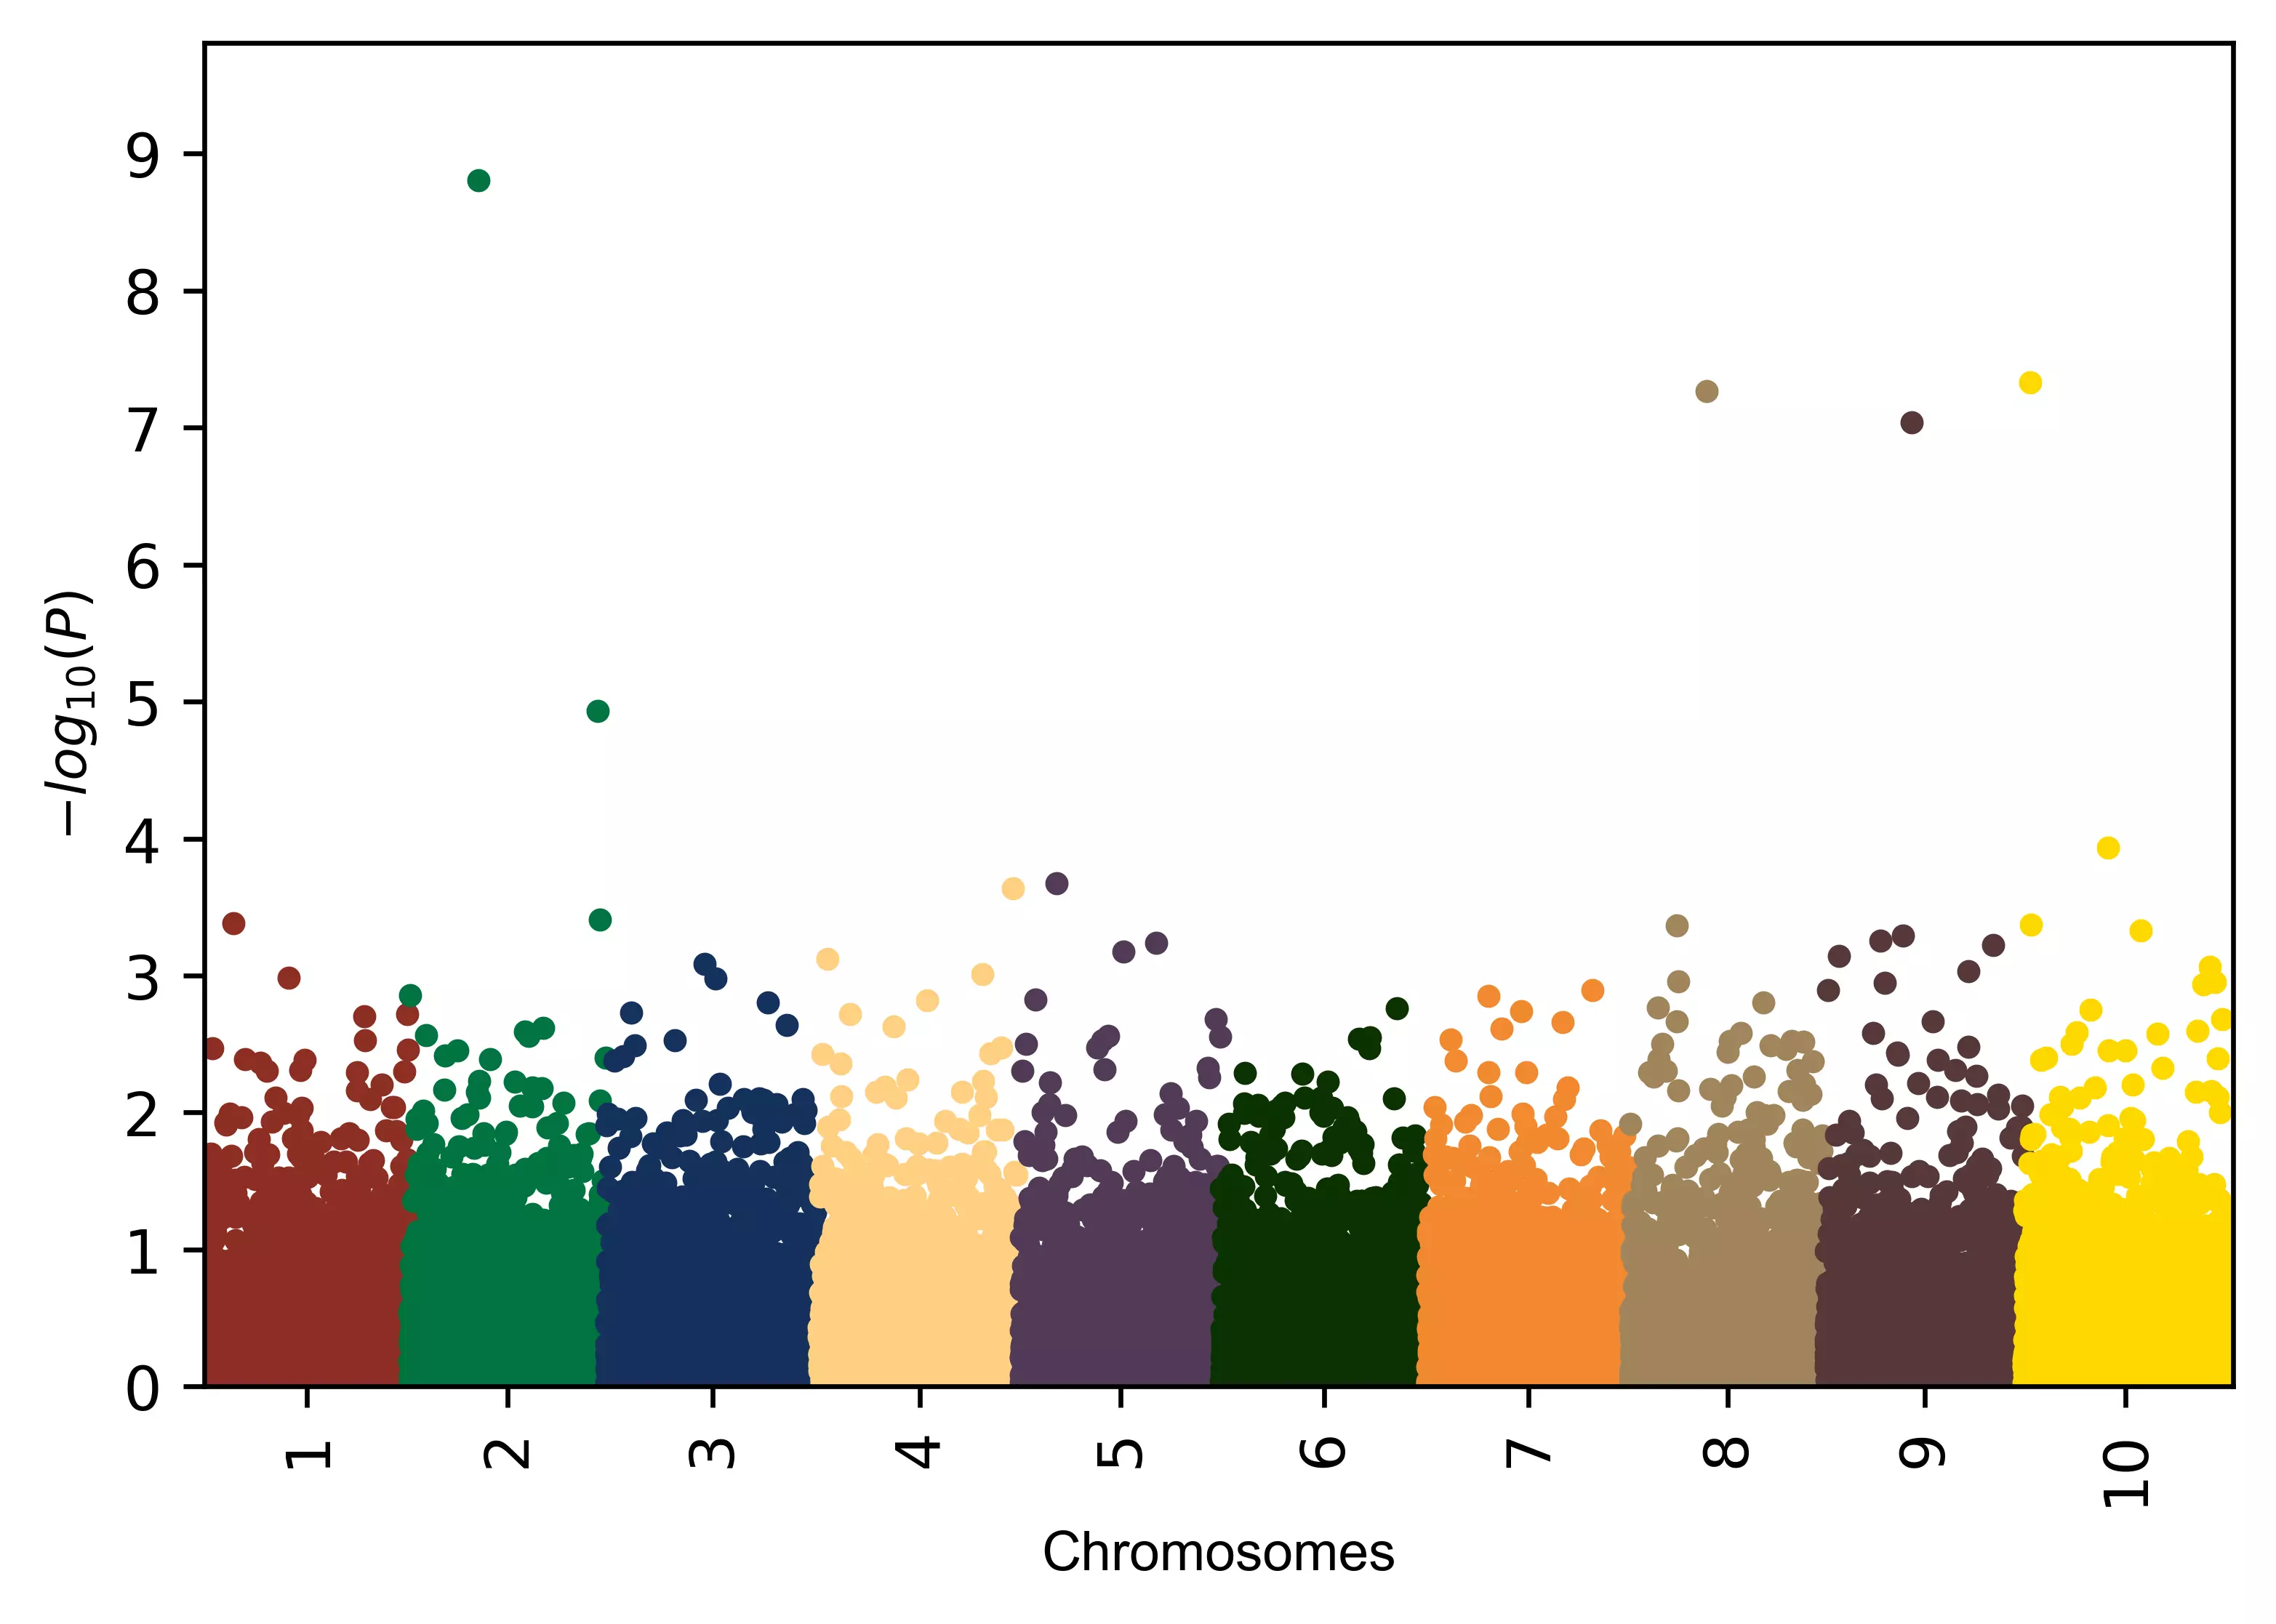
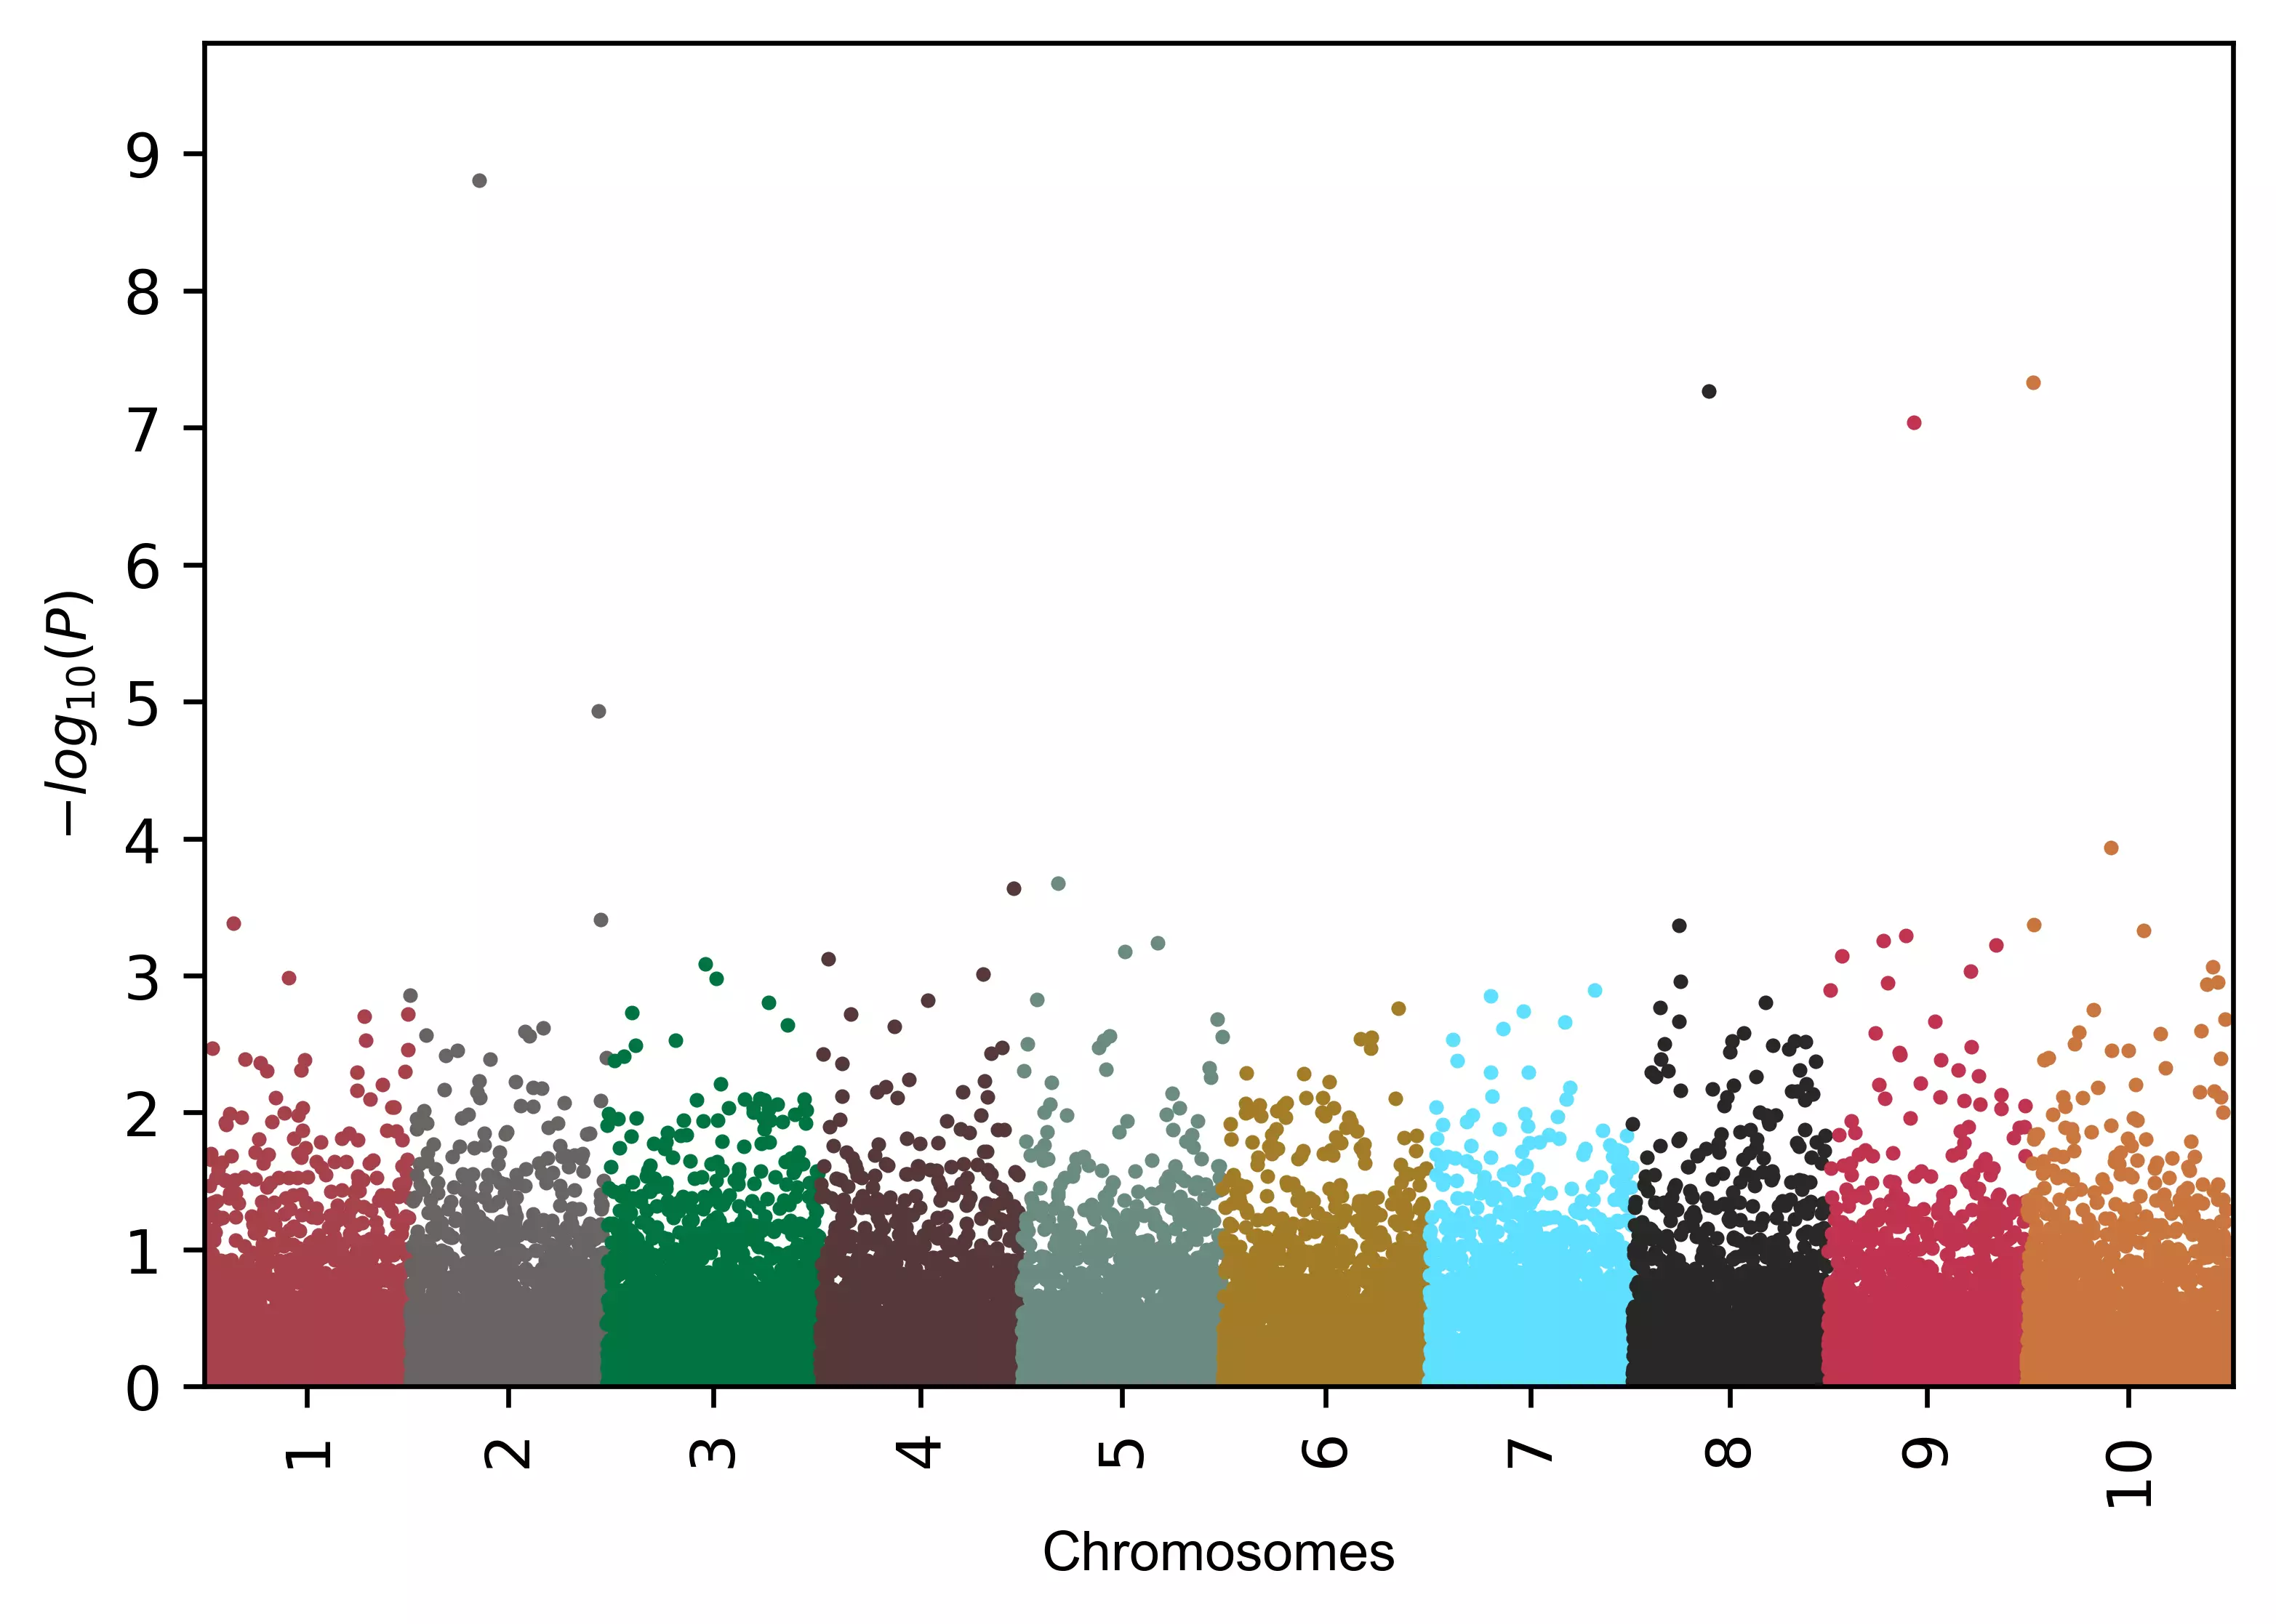
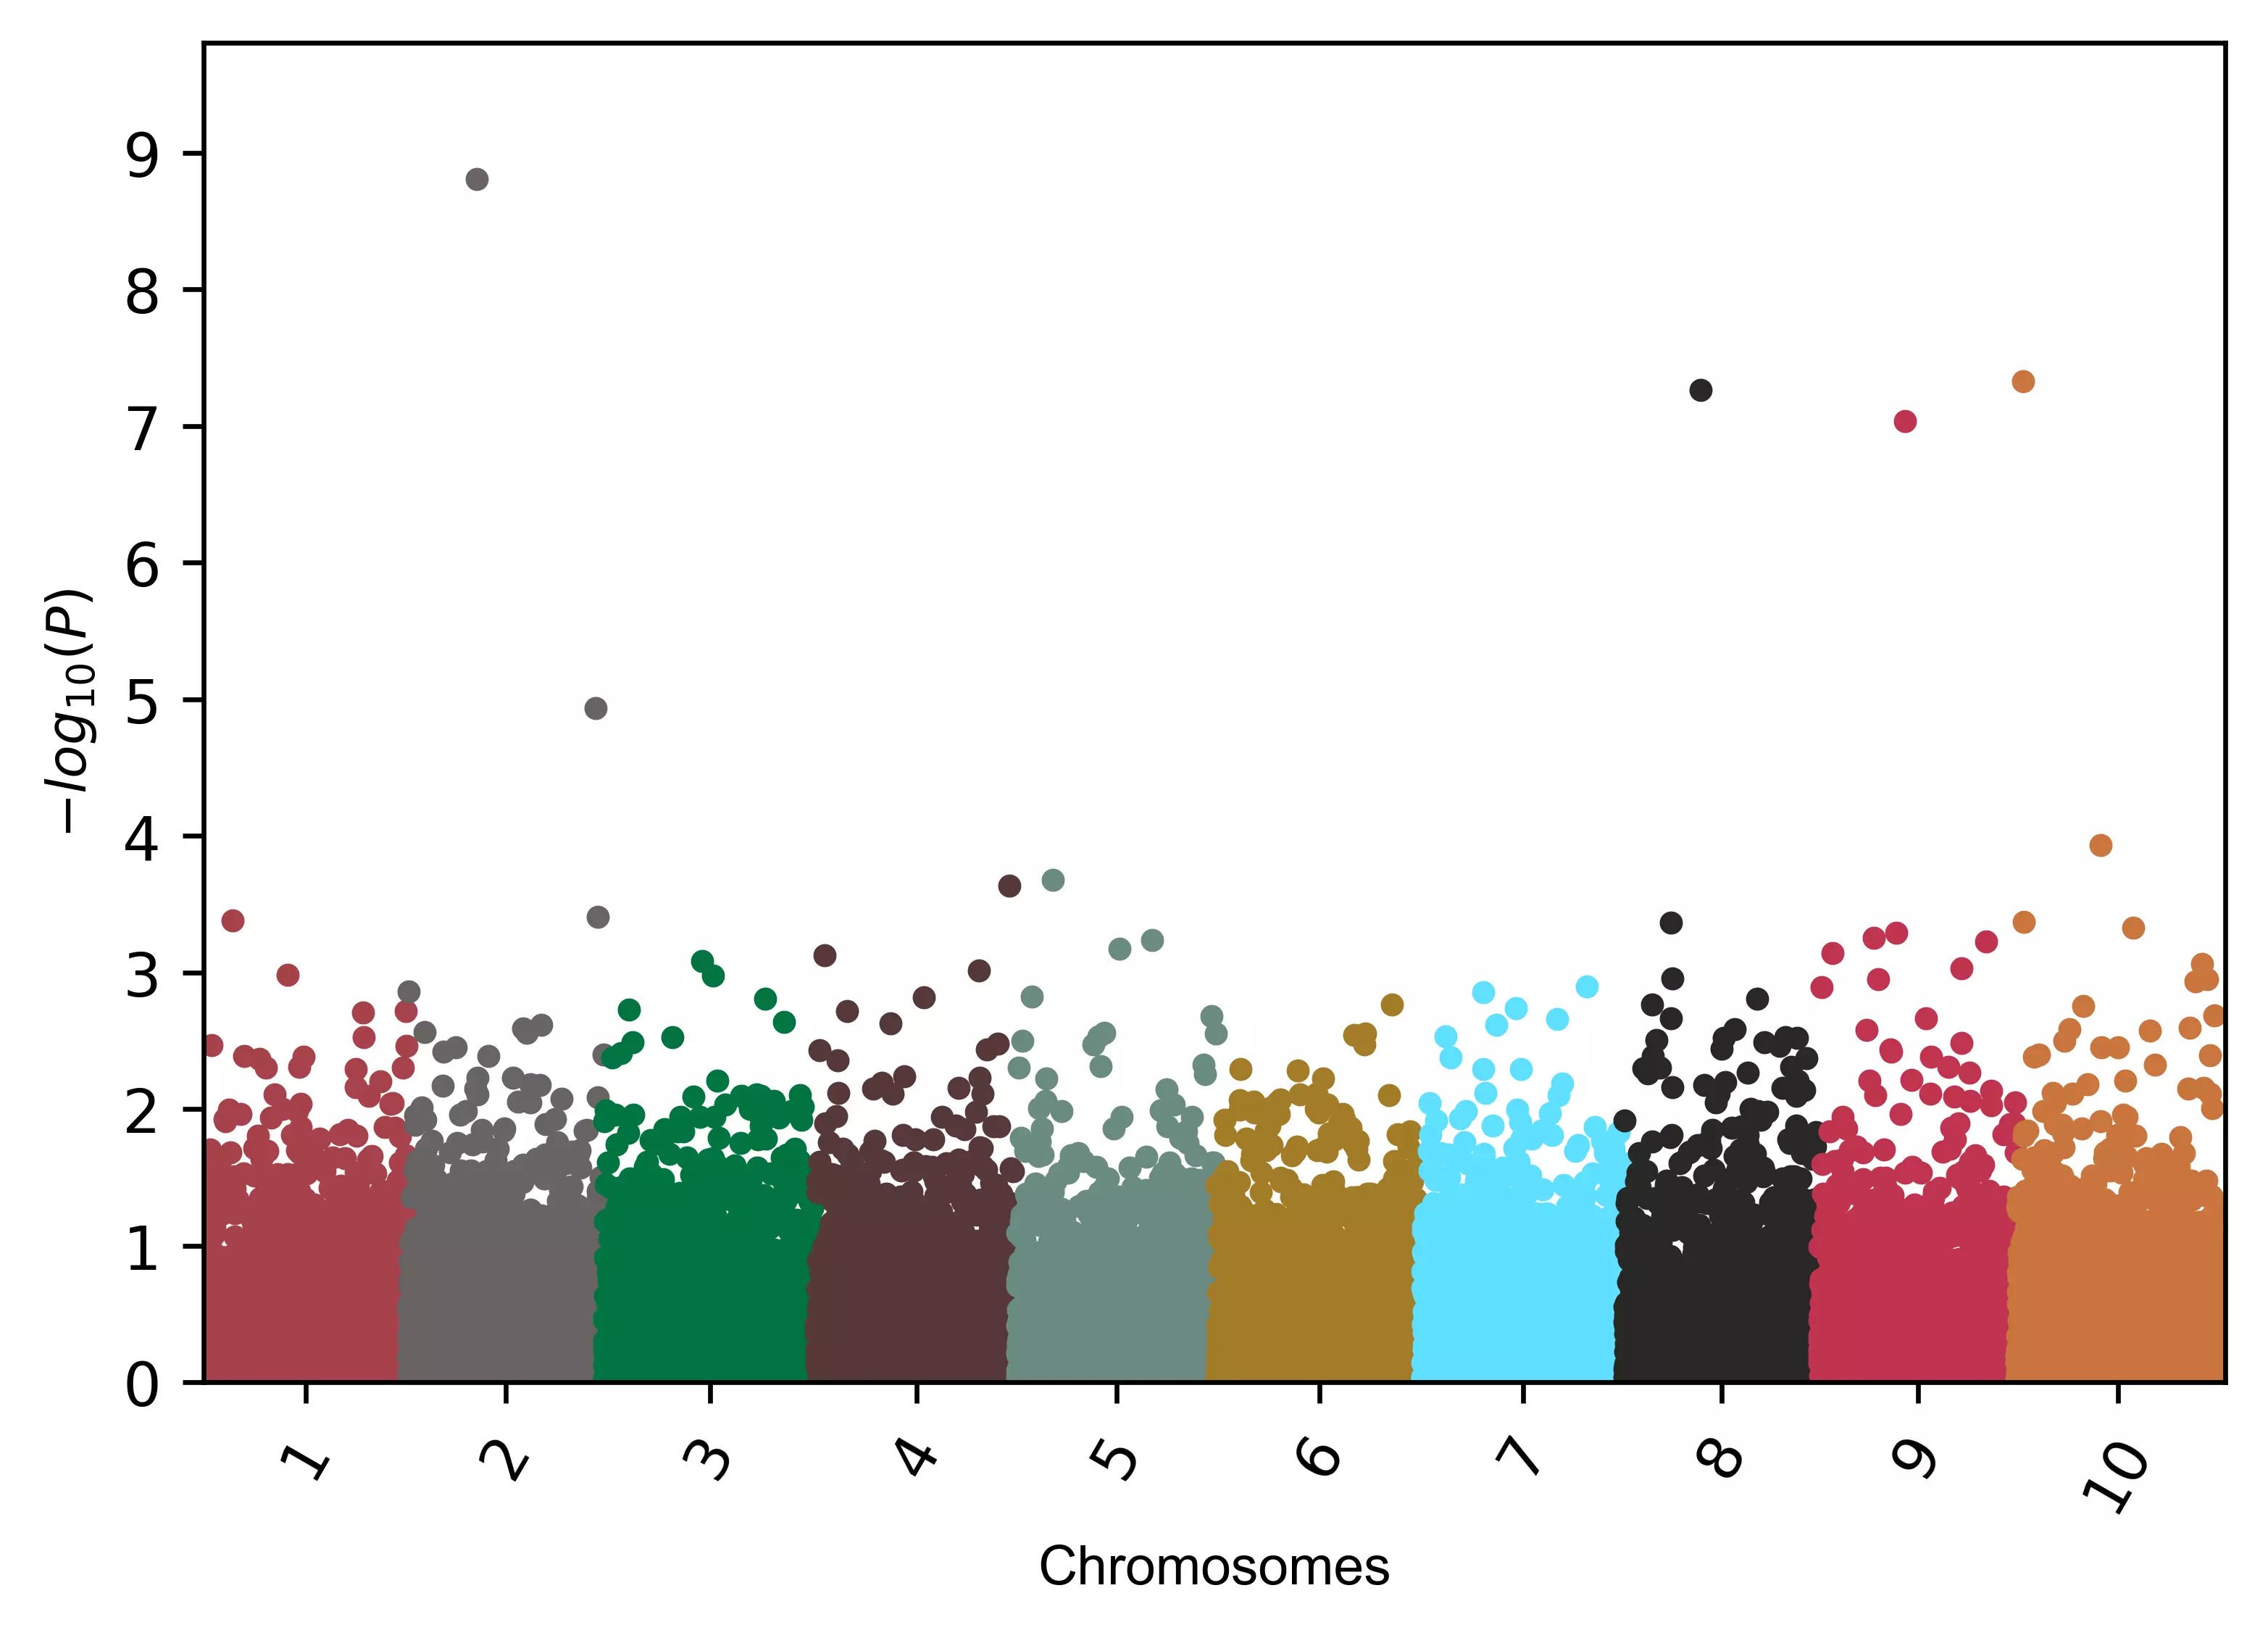
# add different colors equal to number of chromosomes
color=("#a7414a", "#696464", "#00743f", "#563838", "#6a8a82", "#a37c27", "#5edfff", "#282726", "#c0334d", "#c9753d")
visuz.marker.mhat(df=df, chr='chr',pv='pvalue', color=color)

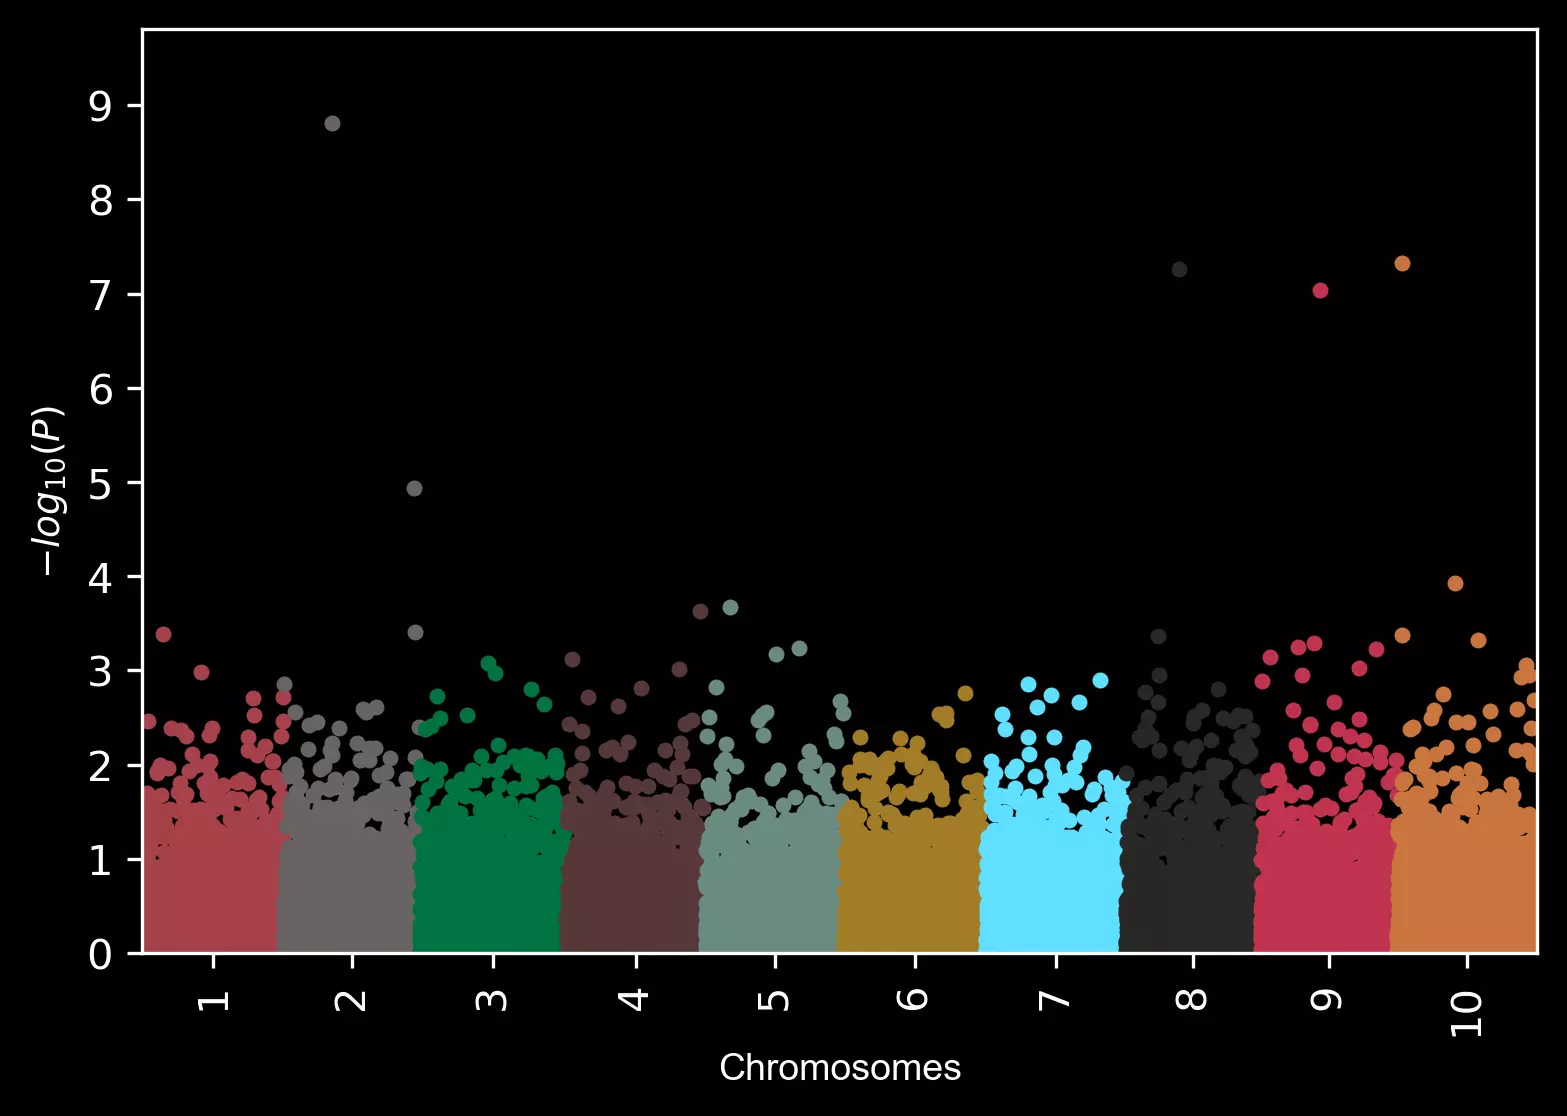
Change background theme to dark,
visuz.marker.mhat(df=df, chr='chr',pv='pvalue', color=color, theme='dark')
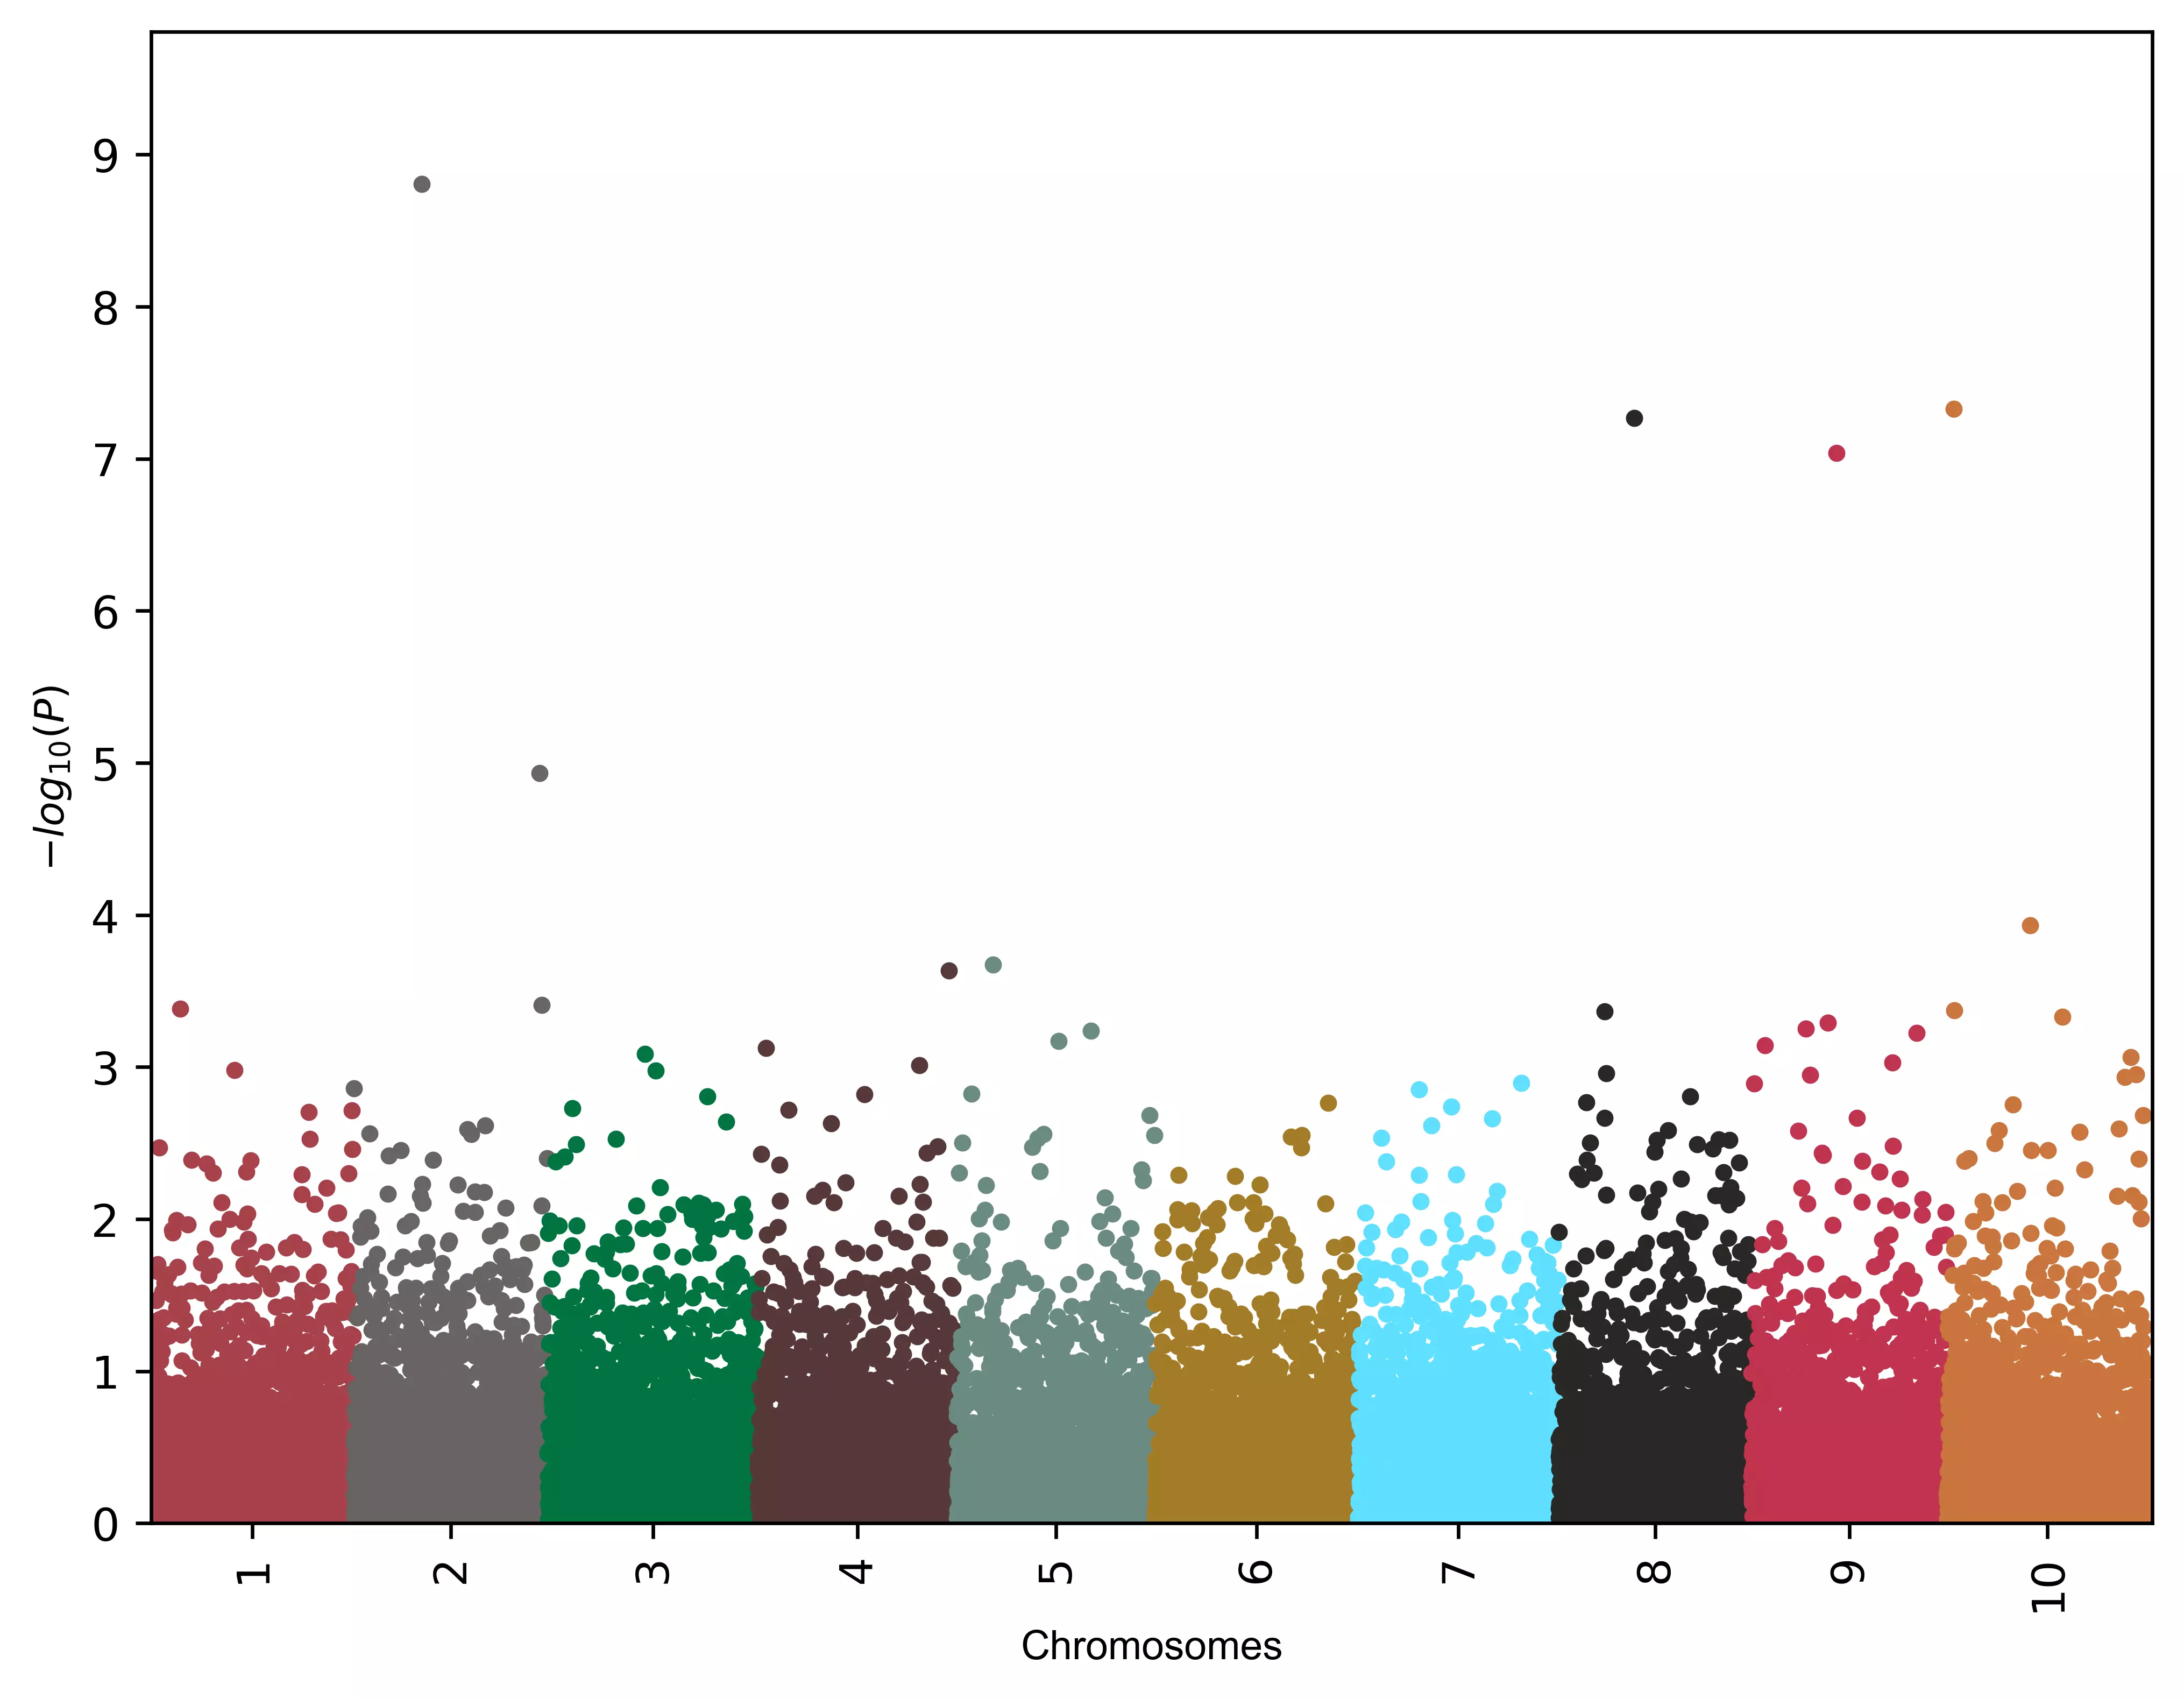
Add genome-wide significance line,
# by default line will be plotted at P=5E-08
# you can change this value as per need
visuz.marker.mhat(df=df, chr='chr',pv='pvalue', color=color, gwas_sign_line=True)

# Change the position of genome-wide significance line
# you can change this value as per need
visuz.marker.mhat(df=df, chr='chr',pv='pvalue', color=color, gwas_sign_line=True, gwasp=5E-06)

Add annotation to SNPs (default text),
# add name to SNPs based on the significance defined by 'gwasp'
visuz.marker.mhat(df=df, chr='chr',pv='pvalue', color=color, gwas_sign_line=True, gwasp=5E-06,
    markernames=True, markeridcol='SNP')

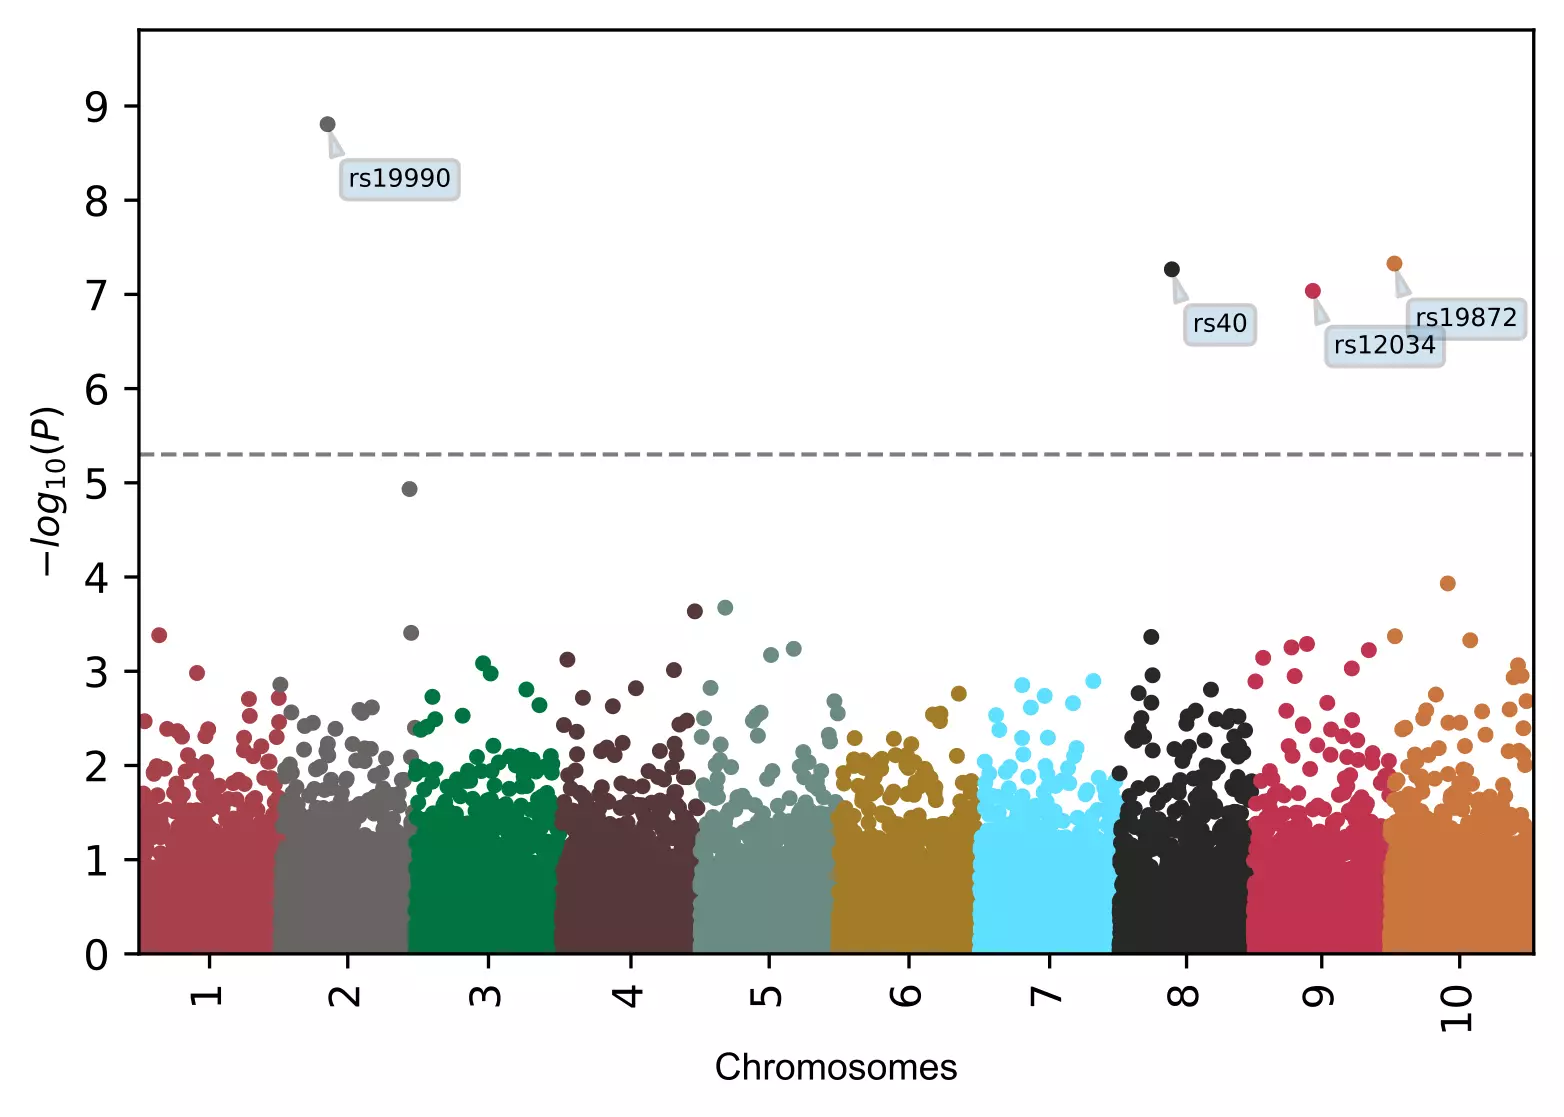
Add annotation to SNPs (box text),
# add name to SNPs based on the significance defined by 'gwasp'
visuz.marker.mhat(df=df, chr='chr',pv='pvalue', color=color, gwas_sign_line=True, gwasp=5E-06,
    markernames=True, markeridcol='SNP', gstyle=2)
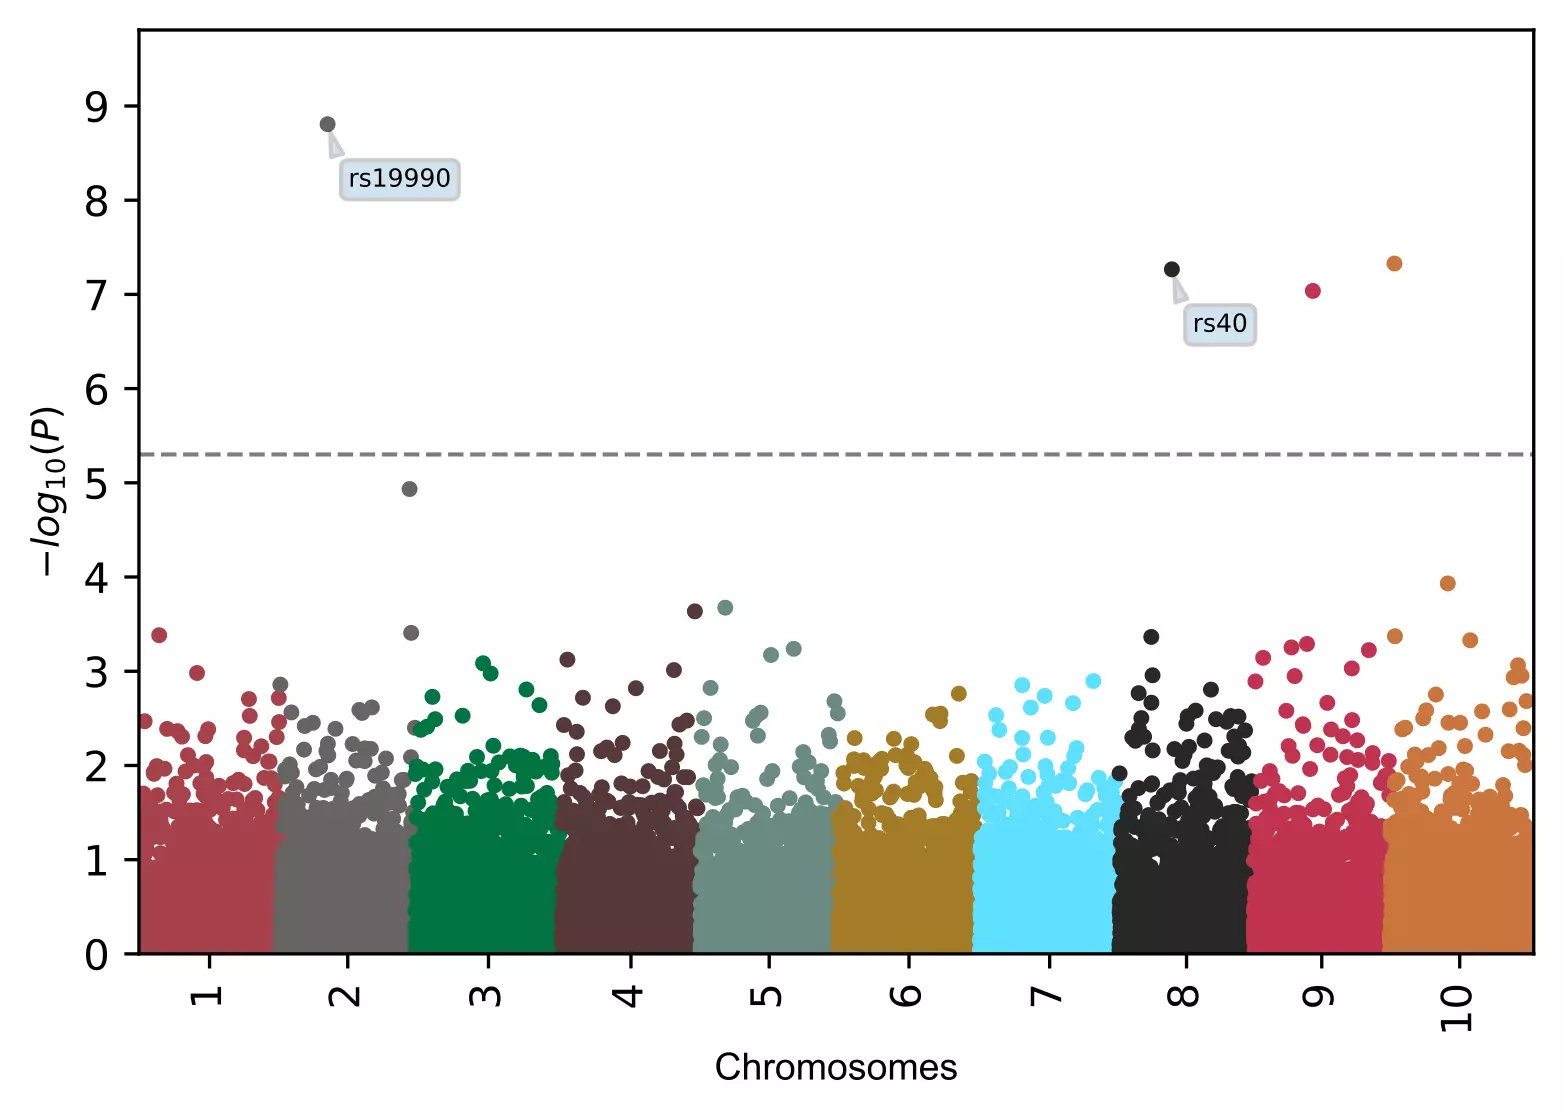
# add name to specified  SNPs only
visuz.marker.mhat(df=df, chr='chr',pv='pvalue', color=color, gwas_sign_line=True, gwasp=5E-06,
    markernames=("rs19990", "rs40"), markeridcol='SNP')

# add name to specified  SNPs only (box text)
visuz.marker.mhat(df=df, chr='chr',pv='pvalue', color=color, gwas_sign_line=True, gwasp=5E-06,
    markernames=("rs19990", "rs40"), markeridcol='SNP', gstyle=2)
# change fontsize of SNP annotation
visuz.marker.mhat(df=df, chr='chr',pv='pvalue', color=color, gwas_sign_line=True, gwasp=5E-06, markernames=True,
    markeridcol='SNP', gfont=5)
# gfont is incompatible with gstyle

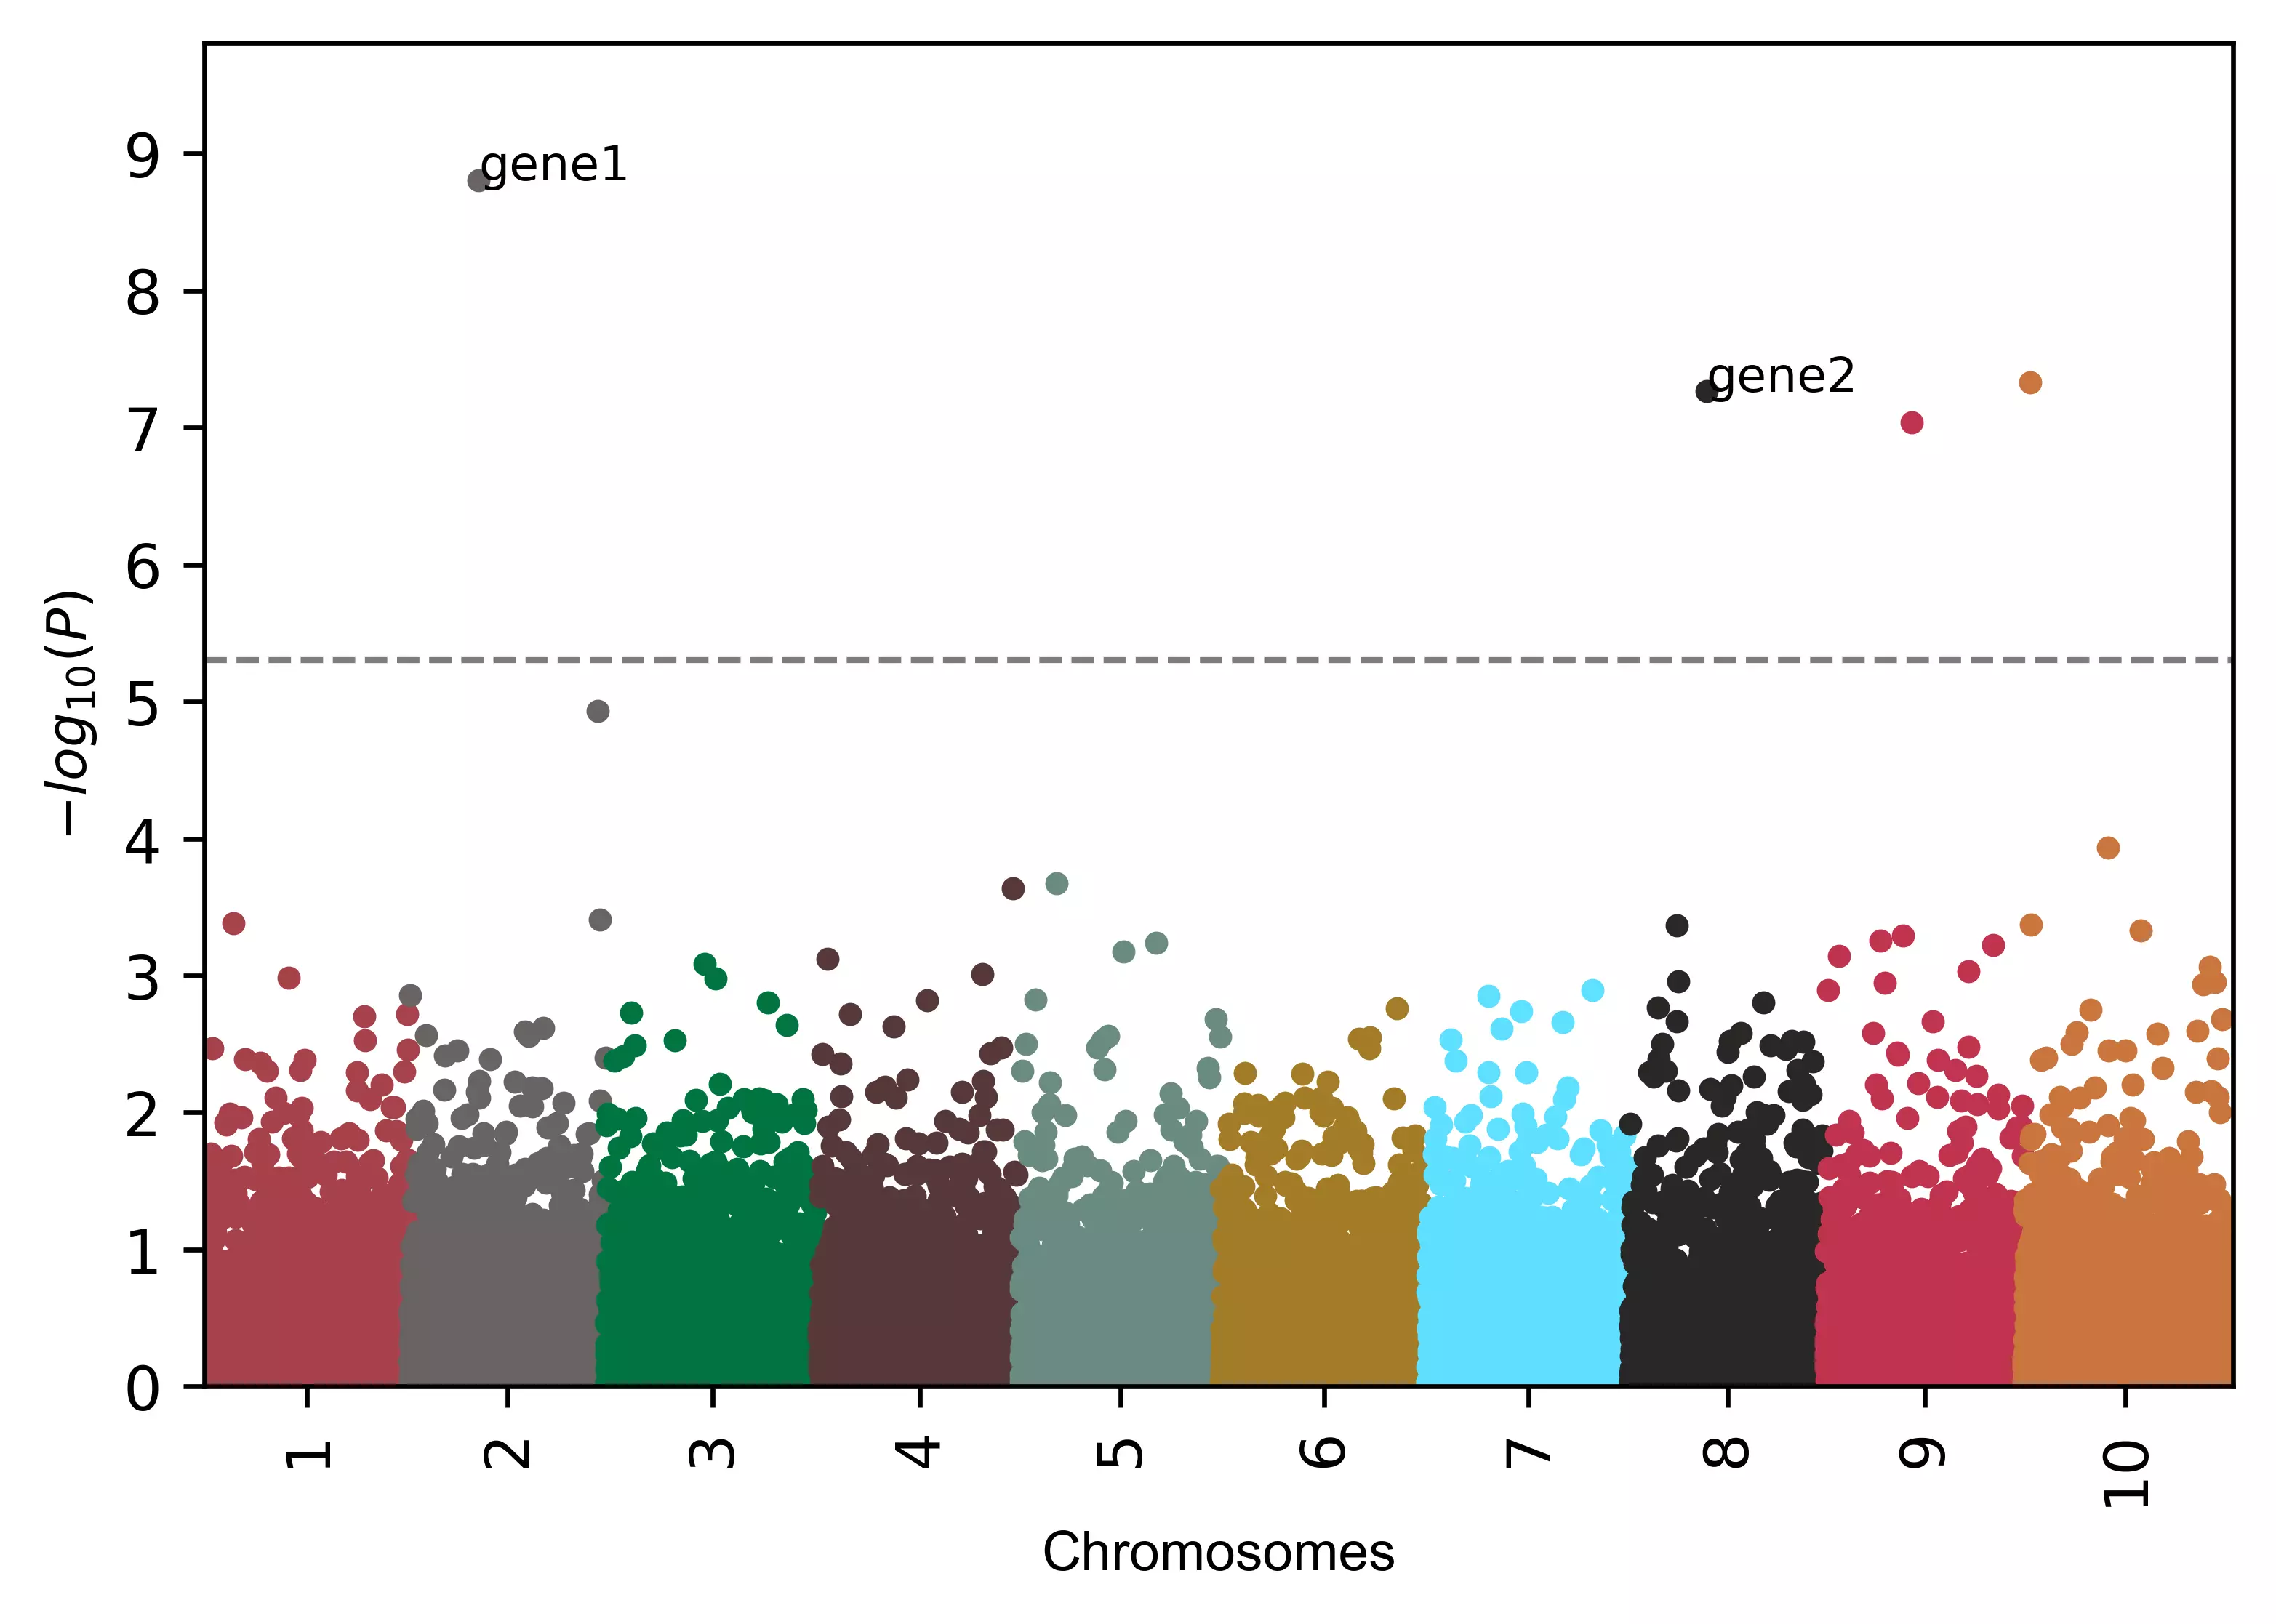
# add gene names to SNPs
visuz.marker.mhat(df=df, chr='chr',pv='pvalue', color=color,
gwas_sign_line=True, gwasp=5E-06, markernames=({"rs19990":"gene1", "rs40":"gene2"}), markeridcol='SNP')
Change fontsize, figure size, resolution, point size, and transparency
# change figure size
visuz.marker.mhat(df=df, chr='chr',pv='pvalue', color=color, dim=(8,6) )
# change point size
visuz.marker.mhat(df=df, chr='chr',pv='pvalue', color=color, dotsize=2 )
# change point transparency
visuz.marker.mhat(df=df, chr='chr',pv='pvalue', color=color, valpha=0.2 )
# change X-axis tick label rotation
visuz.marker.mhat(df=df, chr='chr',pv='pvalue', color=color, ar=60 )
# change figure resolution
visuz.marker.mhat(df=df, chr='chr',pv='pvalue', color=color, r=600 )

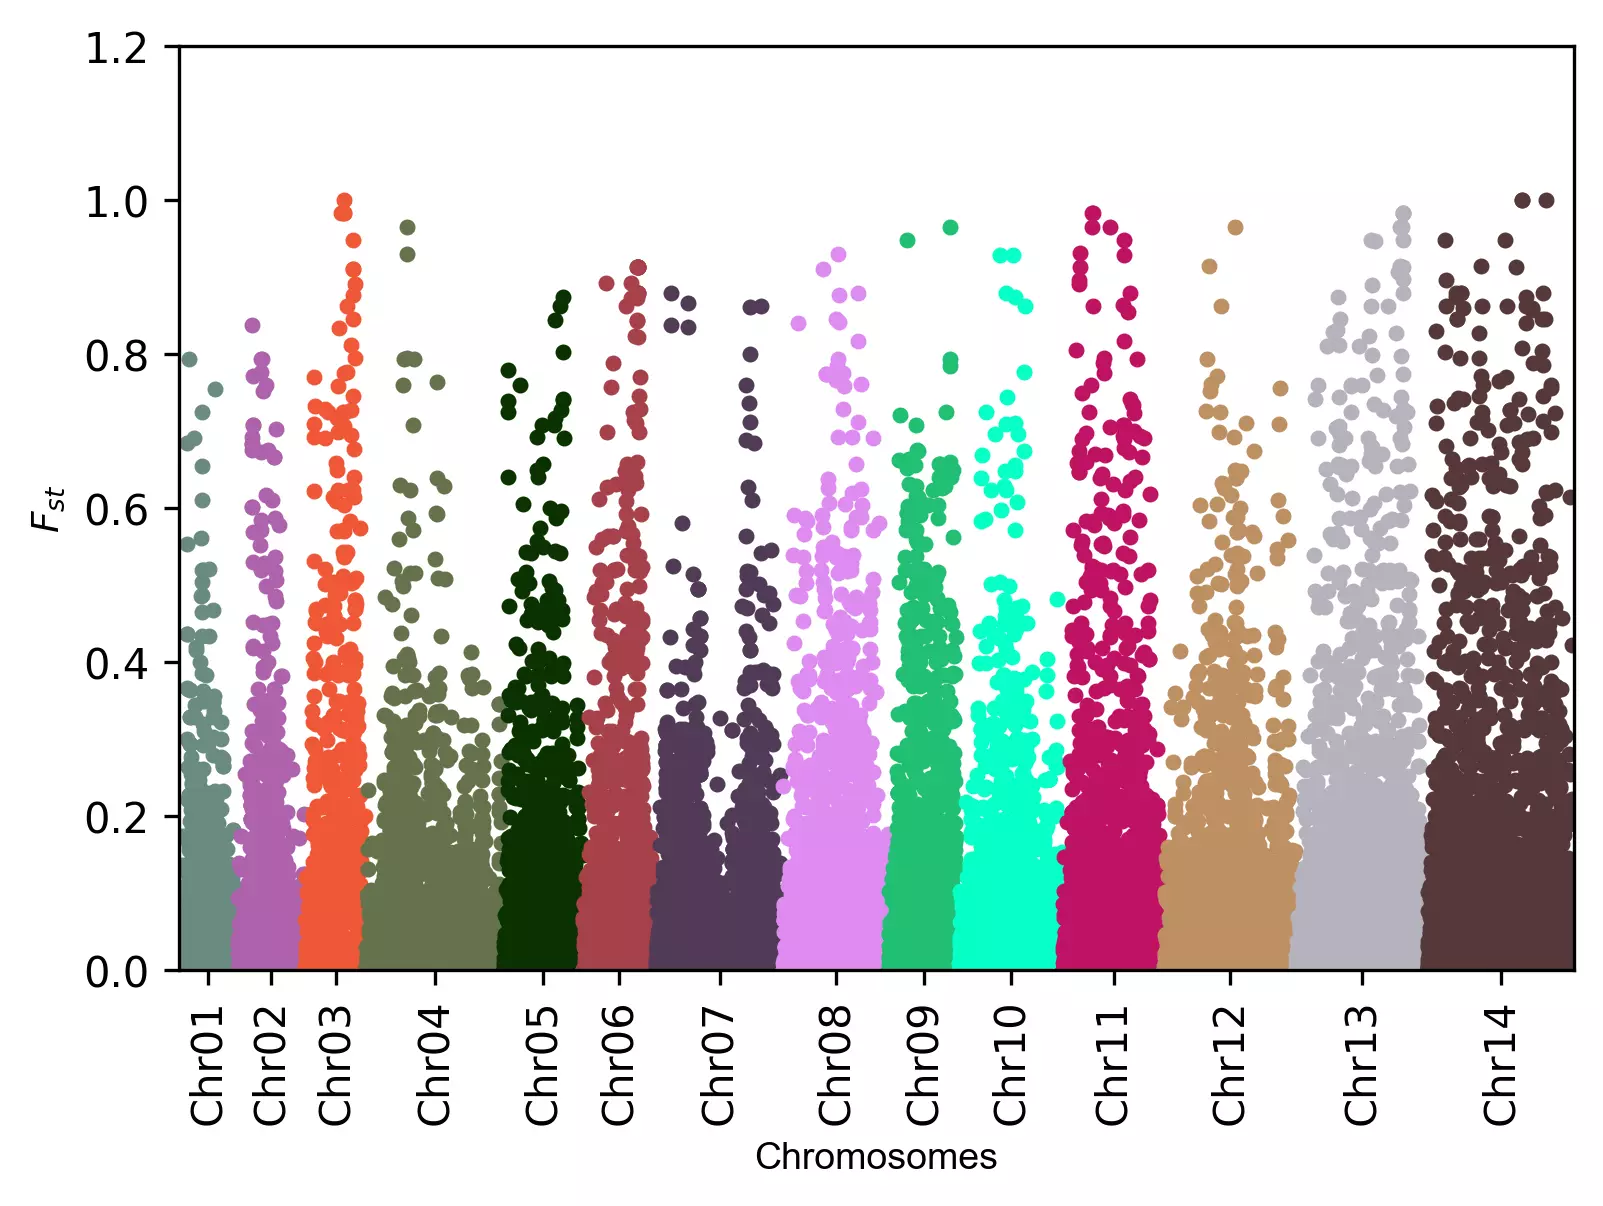
Manhattan plot with the Fst values,
# load dataset
# this dataset is provided by the Vincent Appiah, which is downloaded from the The Pf3K Project (pilot data release 5)
df = analys.get_data('fst').data
df.head(2)
   CHROM   POS       Fst
0  Chr01  1435  0.052571
1  Chr01  1450  0.014399

visuz.marker.mhat(df=df, chr='CHROM',pv='Fst', log_scale=False, ylm=(0,1.3,0.2), axylabel=r'$F_{st}$')
In addition to these parameters, the parameters for figure type (figtype), Y axis ticks range (ylm), axis labels (axxlabel, axylabel),
axis labels font size (axlabelfontsize`) can be provided.
Check detailed usage
References
- The Pf3K Project (2016): pilot data release 5. www.malariagen.net/data/pf3k-5
If you have any questions, comments or recommendations, please email me at reneshbe@gmail.com
This work is licensed under a Creative Commons Attribution 4.0 International License

