How to Create Histogram Using NumPy
A histogram is useful for visualizing the frequency distribution of data as a bar graph. The height of the bar in the histogram represents the frequency counts of observations falling into each interval (bins).
In this article, you will learn how to create the histogram using the numpy.histogram() function from Python NumPy package.
The general syntax of numpy.histogram() looks like this:
# import package
import numpy as np

# generate random numbers
np.histogram(data, bins=10)
Where,
| Parameter | Description |
|---|---|
data |
Input data in array format |
bins |
number of equal-width bins. It can be single int value or sequence of values (default is 10) |
The following examples explains how to use the numpy.histogram() function to generate histogram in Python.
Example 1: Generate default histogram
The following example shows how to generate a histogram using a numpy.histogram().
By default, the numpy.histogram() function generates 10 intervals for the histogram
# import package
import numpy as np
# generate random data
data = np.random.uniform(low=1, high=100, size=100)
# create numpy histogram with 10 intervals
hist, bins = np.histogram(data)
print(hist, bins)
# output
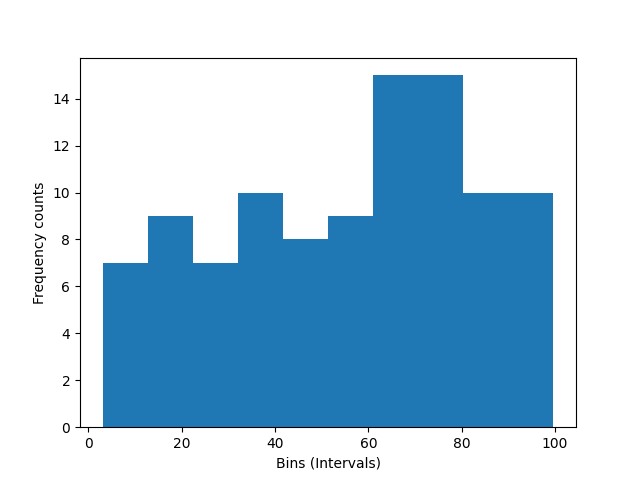
[ 7 9 7 10 8 9 15 15 10 10]
[ 3.01807371 12.68467772 22.35128173 32.01788575 41.68448976 51.35109377
61.01769778 70.6843018 80.35090581 90.01750982 99.68411384]
In the above output, the first array is frequency counts for each bin (equally-spaced intervals) and second array is the edges of the bins.
Now, plot the histogram,
# import package
import matplotlib.pyplot as plt

# draw histogram
plt.hist(data, bins=bins)
plt.xlabel("Bins (Intervals)")
plt.ylabel("Frequency counts")
plt.show()
Example 2: Generate histogram with specific bins
The following example shows how to generate a histogram with specific bins (intervals) using a numpy.histogram() function.
# import package
import numpy as np
# generate random data
data = np.random.uniform(low=1, high=100, size=100)
# create numpy histogram with 10 specific intervals
hist, bins = np.histogram(data, bins=[1, 10, 20, 30, 40, 50, 60, 70, 80, 90, 100])
print(hist, bins)
# output
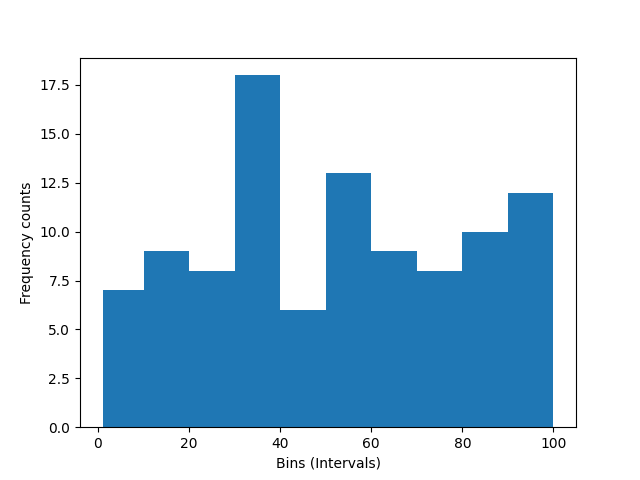
[ 7 9 8 18 6 13 9 8 10 12]
[ 1 10 20 30 40 50 60 70 80 90 100]
In the above output, the first array is frequency counts for each bin (equally-spaced interval) and the second array is the edges of the bins.
Now, plot the histogram,
# import package
import matplotlib.pyplot as plt

# draw histogram
plt.hist(data, bins=bins)
plt.xlabel("Bins (Intervals)")
plt.ylabel("Frequency counts")
plt.show()
Enhance your skills with courses on Statistics and Python
- Introduction to Statistics
- Python for Everybody Specialization
- Python 3 Programming Specialization
- Statistics with Python Specialization
- Advanced Statistics for Data Science Specialization
This work is licensed under a Creative Commons Attribution 4.0 International License
Some of the links on this page may be affiliate links, which means we may get an affiliate commission on a valid purchase. The retailer will pay the commission at no additional cost to you.

