Create a line plot using pandas DataFrame (pandas.DataFrame.plot.line)

The line plots are useful to study the relationship between the variables by connecting the data points as line. The
lines can be straight or curved.
In Python, line plots are typically created from numerical arrays using the pyplot.plot()
function available in the matplotlib package. While you are working on the DataFrame, pandas plotting features can be
handy for creating line plots.
This tutorial will show you how to create a line plot directly from a pandas
DataFrame columns using a plot.line() function. The plot.line()
function takes the following arguments for creating a line plot,
- x: column name for plotting data on X-axis
- y: column name for plotting data on Y-axis
- color: the color of the points (RGB or RGBA code). It can take a single scalar value or multiple values
Now, let’s create a line plot using pandasplot.line()
Import the pandas library
Import the pandas library
import pandas as pd
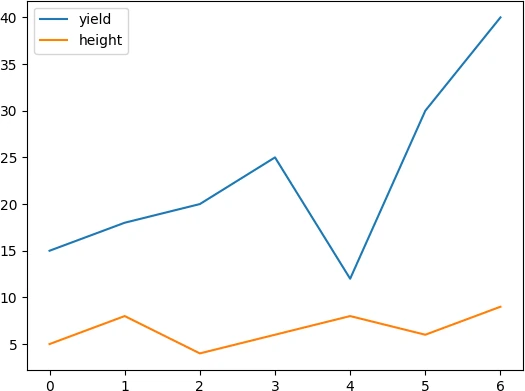
Create a basic pandas line plot
As a first step, we will create a basic line plot (with default settings) using pandas Dataframe. To create this line plot, we will use a pandas DataFrame containing the types of plant varieties, their yields, and their heights.
# create a pandas DataFrame
df = pd.DataFrame({'plant_var':['A', 'B', 'C', 'D', 'E', 'F', 'G'], 'yield':[15, 18, 20, 25, 12, 30, 40],
                    'height':[5, 8, 4, 6, 8, 6, 9] })

# view first two rows of dataset
df.head(2)
# output
  plant_var  yield  height
0         A     15       5
1         B     18       8

# create a line plot
df.plot.line() # same as df.plot()
plt.show()
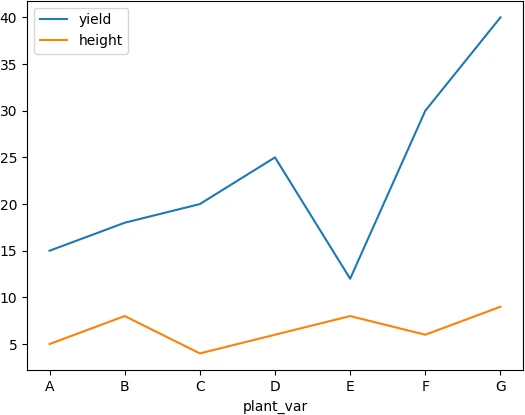
Add labels to X-axis
To add the labels to X-axis, you can make plant_var column as index and then create a line plot,
# set first column as index
df = df.set_index('plant_var')

# view first two rows of dataset
df.head(2)
           yield  height
plant_var
A             15       5
B             18       8

# create a line plot
df.plot.line()
plt.show()
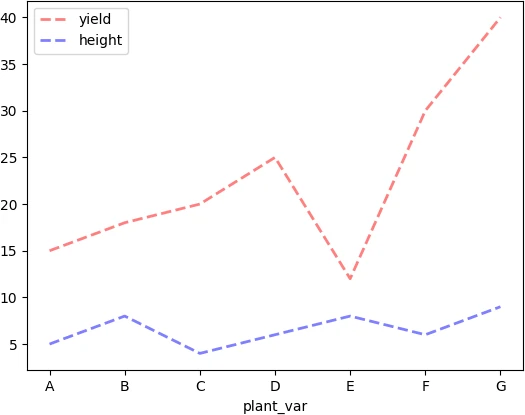
Change color, style, linewidth, and transparency
Change the colors (color),
style, transparency (alpha),
and linewidth of the lines in pandas line plot,
df.plot.line(color = ['r', 'b'], linestyle = 'dashed', alpha = 0.5, linewidth = 2)
plt.show()
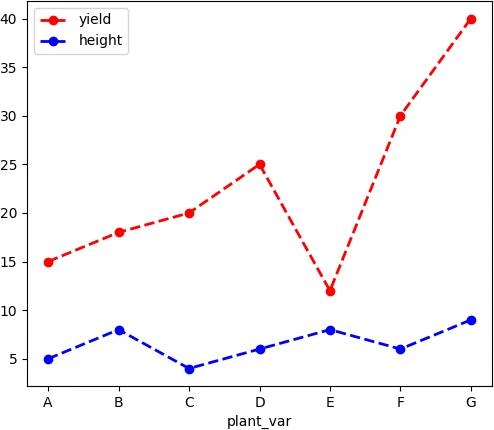
Add marker and change figure size
You can use the marker parameter to add the marker to the lines. Similarly, the figsize(width, height) parameter can be used
for changing the figure size of the pandas line plot.
df.plot.line(color = ['r', 'b'], marker = 'o', linestyle = 'dashed', linewidth = 2, figsize = (6, 5) )
plt.show()
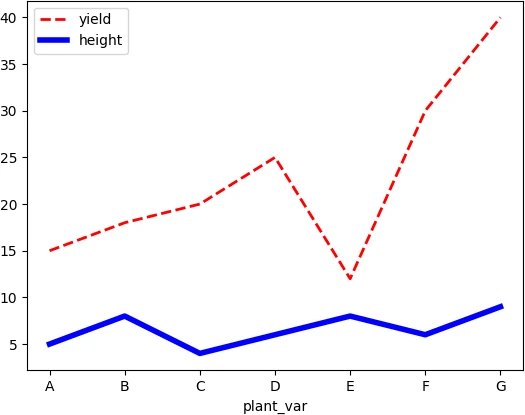
pandas multiple lines plot with customized options
You can plot multiples lines in a pandas line plot with customized parameters for each line. Here, you need to use
plt.subplots() to get a tuple of figure (fig) and axis (ax) objects. The axis object is useful for
customizing each line (e.g. for line style, color, width, etc.) in same line plot. Here, we need
to specify the X and Y-axis names as column names from DataFrame.
# create DataFrame
df = pd.DataFrame({'plant_var':['A', 'B', 'C', 'D', 'E', 'F', 'G'], 'yield':[15, 18, 20, 25, 12, 30, 40],
                    'height':[5, 8, 4, 6, 8, 6, 9] })

# line plot
fig, ax = plt.subplots()
df.plot.line(ax = ax, x = 'plant_var',y = 'yield', color = 'r', linewidth = 2, linestyle ='dashed')
df.plot.line(ax = ax, x ='plant_var', y = 'height', color = 'b', linewidth= 4, linestyle = 'solid')
plt.show()
If you want to create two subplots, add the subplots=True parameter to the line() function,
# create two subplots
fig, ax = plt.subplots()
df.plot.line(subplots=True)
plt.show()

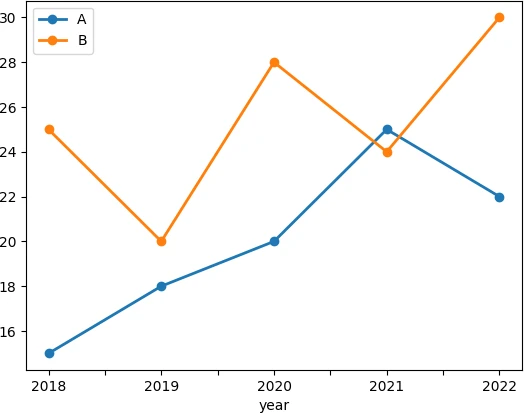
pandas multiple lines plot for categorical column
You can plot multiple lines based on the categorical column in pandas Dataframe. here, you will use the pandas groupby()
function to create a line plot. To create this pandas groupby line plot, we will create a time series dataset
as pandas DataFrame containing the year of planting, types of plant varieties, and their yields.
# create DataFrame
df = pd.DataFrame({'year':['2018', '2019', '2020', '2021', '2022', '2018', '2019', '2020', '2021', '2022'],
                   'plant_var':5*['A'] + 5*['B'],
                   'yield': [15, 18, 20, 25, 22, 25, 20, 28, 24, 30] })

# view first two rows of DataFrame
df.head(2)
# output
  year plant_var  yield
0  2018         A     15
1  2019         A     18


# pandas groupby line plot (plant_var column)
df = df.set_index('year')
df.groupby('plant_var')['yield'].plot(legend=True, marker = 'o', linewidth = 2)
plt.show()
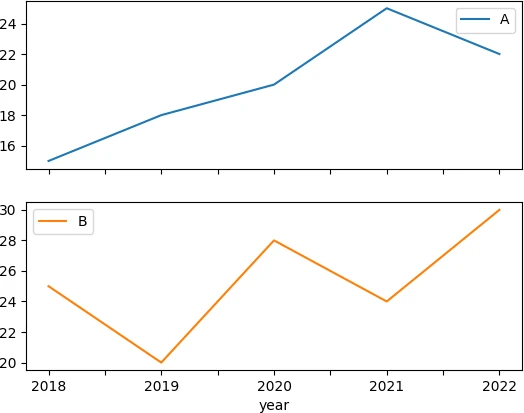
If you want to create two subplots based on the categorical column, you will first need to reshape the DataFrame with
a categorical column and split that into separate columns. You can use the pandas pivot() function to reshape the DataFrame.
df = pd.DataFrame({'year':['2018', '2019', '2020', '2021', '2022', '2018', '2019', '2020', '2021', '2022'],
                   'plant_var':5*['A'] + 5*['B'],
                   'yield': [15, 18, 20, 25, 22, 25, 20, 28, 24, 30] })

# first reshape the DataFrame
df_reshape = df.pivot(index='year', columns='plant_var', values='yield')
# view DataFrame
df_reshape
# output
plant_var   A   B
year
2018       15  25
2019       18  20
2020       20  28
2021       25  24
2022       22  30

# create a grouped line plots as subplots
df_reshape.plot.line(subplots=True)
plt.show()
In summary, you learned how to create a pandas line plot on DataFrame using plot.line() function.
Enhance your skills with courses Python and pandas
- Mastering Data Analysis with Pandas
- Python for Data Analysis: Pandas & NumPy
- Introduction to Data Science in Python
- Python for Everybody Specialization
- Python 3 Programming Specialization
This work is licensed under a Creative Commons Attribution 4.0 International License
Some of the links on this page may be affiliate links, which means we may get an affiliate commission on a valid purchase. The retailer will pay the commission at no additional cost to you.

