Generate dataset with normal distribution in Python

A random dataset with a standard normal distribution (aka Gaussian distribution) i.e N(µ = 0, σ2 = 1) can
be generated using numpy.random.normal function.
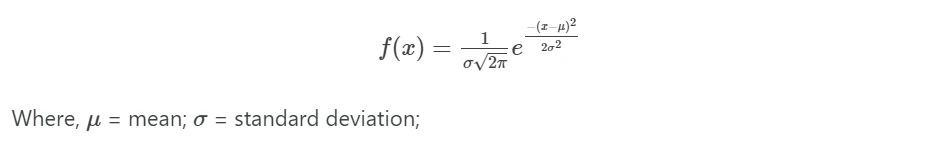
A normal distribution is a type of continuous probability distribution and its probability density function (PDF) for any random variable X is given as,
Generate a random dataset with normal distribution
Let’s generated a random dataset with a standard normal distribution using a numpy.random.normal function,
numpy.random.normal function takes the following arguments as inputs,
loc: Mean value (center) of the random sample
scale: Standard deviation (spread) of the random sample. This should be a non-negative value
size: A random sample size
For example, generate a random sample of size 500 with a mean of 0 and standard deviation of 1 (dataset with a standard normal distribution),
import numpy as np

rand_data = np.random.normal(loc=0, scale=1, size=500)
rand_data
# output
array([-0.15736721,  1.07037315,  0.77830583, ...,  0.08949697,
        0.61544847, -1.16288735])

rand_data.shape
# output
(500,)
Verify the mean and standard deviation of the created random dataset,
import statistics as st
# mean
st.mean(rand_data)
# output
-0.004

# standard deviation
st.stdev(rand_data)
0.9542
The above mean and standard deviation are approximately equal to the provided values to numpy.random.normal function.
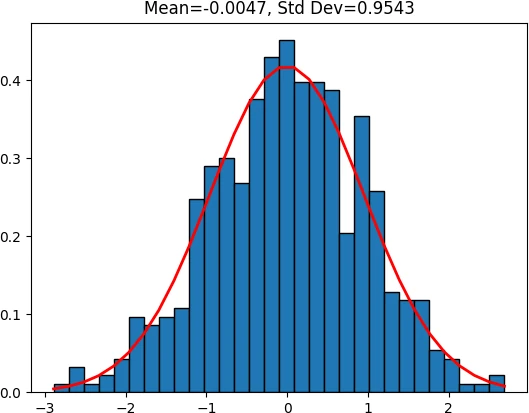
Visualize the standard normal distribution of random dataset with given mean and standard deviation,
import matplotlib.pyplot as plt
from scipy.stats import norm

h = plt.hist(rand_data, bins=30, histtype='bar', density=1, ec='k')
plt.plot(h[1], norm.pdf(h[1], st.mean(rand_data), st.stdev(rand_data)), color='r', linewidth=2)
plt.title(r'Mean=%.4f, Std Dev=%.4f' %(st.mean(rand_data), st.stdev(rand_data)))
plt.show()
Check the standard normal distribution of the randomly generated data using the quantile-quantile (QQ) plot (aka normal probability plot),
Create a QQ plot,
import statsmodels.api as sm

sm.qqplot(rand_data, line='45')
plt.xlabel("Theoretical Quantiles")
plt.ylabel("Sample Quantiles")
plt.show()
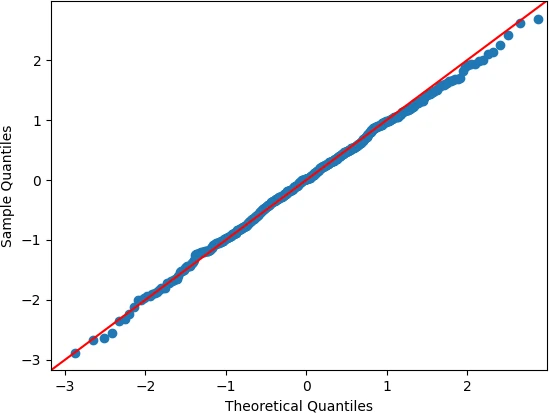
The QQ plot suggests that the generated random data is normally distributed (data plotted on a straight line). If data points don’t appear on a straight line, it could violate the assumption of normal distribution.
Generate a random Dataframe with normal distribution
You can also generate a random DataFrame with multiple columns where each column has a normal distribution
import numpy as np
import pandas as pd

df = pd.DataFrame({'col1': np.random.normal(loc=0, scale=1, size=500),
                   'col2': np.random.normal(loc=2, scale=1, size=500)})

df.head(2)
# output
       col1      col2
0  1.394381  1.049982
1 -0.237809  1.556581

df.shape
# output
(500, 2)
Analyze descriptive statistics on a generated Dataframe,
df.describe()
# output
             col1        col2
count  500.000000  500.000000
mean     0.047423    1.994156
std      1.035954    0.959236
min     -2.479637   -0.693878
25%     -0.673236    1.360467
50%      0.035872    2.001211
75%      0.768002    2.626911
max      3.237509    4.724744
The mean and standard deviation are approximately equal to that one provided in the np.random.normal() function.
Enhance your skills with courses on Statistics and Python
- Introduction to Statistics
- Python for Everybody Specialization
- Understanding Clinical Research: Behind the Statistics
- Statistics with R Specialization
- Data Science: Foundations using R Specialization
- Python for Data Science, AI & Development
References
If you have any questions, comments, corrections, or recommendations, please email me at reneshbe@gmail.com
This work is licensed under a Creative Commons Attribution 4.0 International License

