Perform t-test from scratch in Python
Calculate t-test from scratch
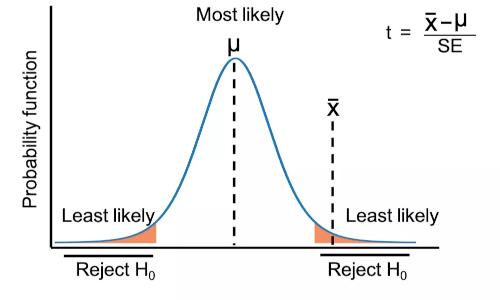
Calculating a t-test (t statistics and p value) from scratch is straightforward and you need to follow the following steps.
- Get the sample data
- Calculate the mean of the samples
- Calculate the standard error
- Calculate t statistics
- Compare it with the t critical values to get the p value
Calculate one sample t-test from scratch
Let’s calculate one sample t-test (see dataset and formula for one sample t-test),
import numpy as np
from bioinfokit.analys import get_data
# load dataset as pandas dataframe
df = get_data('t_one_samp').data
# get as numpy array
a =  df['size'].to_numpy()
# known population mean
mu = 5

# Calculate the mean and standard error
mean = np.mean(a)
std_error = np.std(a) / np.sqrt(len(a))

# calculate t statistics
t = abs(mean - mu) / std_error
t
# output
0.37162508611635603
- Now, calculated t statistics need to compare with t critical values for finding the p value and hypothesis testing.
- t critical value is a t statistic computed with a given significance level (α, type I error) and degree of freedom (n-1). It is denoted as tα,n-1. For example, t critical value for the two-tailed test with α = 0.05 and 49 degrees of freedom is 2.009 (see t critical value table ). t critical value can be computed in Python as follows,
from scipy import stats
# two-tailed critical value at alpha = 0.05
# q is lower tail probability and df is the degrees of freedom
t_crit = stats.t.ppf(q=0.975, df=49)
t_crit
# output
2.009575234489209

# one-tailed critical value at alpha = 0.05
t_crit = stats.t.ppf(q=0.95, df=49)
t_crit
# output
1.6765508919142629

# get two-tailed p value
p = 2*(1-stats.t.cdf(x=t, df=49))
# output
0.7117742097899655

# get one-tailed p value
p = 1-stats.t.cdf(x=t, df=49)
# output
0.35588710489498276
- As the calculated t statistic (0.3716) is less than the t critical value (2.009) and the two-tailed p value is 0.71, we fail to reject the null hypothesis and conclude that the sample mean is equal to the known population mean.
Calculate two sample t-test from scratch
Let’s calculate two sample t-test (see dataset and formula for two sample t-test),
import numpy as np
from bioinfokit.analys import get_data
# load dataset as pandas dataframe
df = get_data('t_ind_samp').data
# get as numpy array
x1 = df.loc[df['Genotype'] == 'A', 'yield'].to_numpy()
x2 = df.loc[df['Genotype'] == 'B', 'yield'].to_numpy()

# Calculate the mean and standard error
x1_bar, x2_bar = np.mean(x1), np.mean(x2)
n1, n2 = len(x1), len(x2)
var_x1, var_x2= np.var(x1, ddof=1), np.var(x2, ddof=1)

# pooled sample variance
pool_var = ( ((n1-1)*var_x1) + ((n2-1)*var_x2) ) / (n1+n2-2)

# standard error
std_error = np.sqrt(pool_var * (1.0 / n1 + 1.0 / n2))

# calculate t statistics
t = abs(x1_bar - x2_bar) / std_error
t
# output
5.407091104196024
- t critical value for two sample t-test is denoted as tα,n1+n2-1. For example, t critical value for the two-tailed test with α = 0.05 and 11 degrees of freedom is 2.201 (see t critical value table ). t critical value can be computed in Python as follows,
from scipy import stats
# two-tailed critical value at alpha = 0.05
# q is lower tail probability and df is the degrees of freedom
t_crit = stats.t.ppf(q=0.975, df=11)
t_crit
# output
2.200985160082949

# one-tailed critical value at alpha = 0.05
t_crit = stats.t.ppf(q=0.95, df=11)
t_crit
# output
1.7958848187036691

# get two-tailed p value
p = 2*(1-stats.t.cdf(x=t, df=11))
# output
0.000214337566542655

# get one-tailed p value
p = 1-stats.t.cdf(x=t, df=11)
# output
0.0001071687832713275
- As the calculated t statistic (5.407) is greater than the t critical value (2.2009) and the two-tailed p value is 0.0002, we reject the null hypothesis in favor of the alternate hypothesis and conclude that the two groups means are significantly different.
This work is licensed under a Creative Commons Attribution 4.0 International License

