A guide to understanding the variant information fields in variant call format (VCF) file
Variant Call Format (VCF)
- The Variant Call Format (VCF) file produced by variant calling software (e.g. GATK, FreeBayes, SAMtools) contains the information for polymorphic loci (variants) and probabilistic measures present in the sample or population.
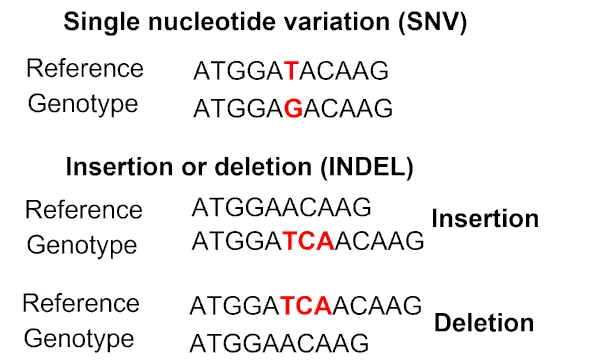
- The variants can be single nucleotide variants (SNV) or a stretch of insertions or deletions (INDEL). The single nucleotide polymorphism (SNPs) are the DNA variants (SNV) detectable in >1% of population under study.
- In the VCF file, the variant data is represented by 8 fixed columns (#CHROM, POS, ID, REF, ALT, QUAL, FILTER and INFO). The INFO columns contain additional information about the variants. The INFO column is followed by FORMAT and then by individual sample IDs.
- Several genotype related fields are present in the INFO or FORMAT column in the VCF file, which gives various metrics related to called genotypes and are useful for filtering for downstream analysis.
- Thousands to millions of variants and associated information can be saved in VCF file
Here, I will discuss some of important genotype related fields,
GT (Genotype)
- GT refers to the most likely genotype of the sample. The alleles are separated by
/or| - For diploid organisms, it has
0value for reference allele and1for the alternate allele (non-reference allele).
| genotype | description |
|---|---|
0/0 |
the sample is a homozygous reference |
0/1 |
the sample is heterozygous (carries both reference and alternate alleles) |
1/1 |
the sample is a homozygous alternate |
./. |
No genotype called or missing genotype |
GP (Genotype posterior probabilities)
- Phred-scale based genotype posterior probabilities calculated using Bayes’ formula, which ranges from 0 to 1.
- GP tag has three subfields for homozygous reference, heterozygous, and homozygous alternate genotypes probabilities.
- The highest probability of possible genotypes is used for assigning the genotype. For example, if GP is 0.11,0.62,0.27,
then the genotype is heterozygous (
0/1) as it has the highest probability (0.62). - The probabilities of genotypes always sum to 1.
GL and PL (Genotype likelihoods)
- GL refers to log10-scaled genotype likelihoods
- PL refers to Phred-scaled genotype likelihoods. The most likely genotype has a PL value of 0.
- Similar to GP, GL and PL tag has three subfields for homozygous reference, heterozygous, and homozygous alternate genotypes likelihoods.
DP, DP4, and AD (Read depth)
- DP refers to the overall read depth from all target samples supporting the genotype call.
- Generally, markers are retained with DP > 10 or DP > 5 to get high-quality genotypes. This value can be changed based on research applications. For example, in clinical research higher DP is desirable for filtering.
- DP4 field have four subfields for sequence reads covering the variant. These subfields refer to reference allele covered by forward read, reference allele covered by reverse read, alternate allele covered by forward read, and alternate allele covered by reverse read. DP4 may not sum to DP as it excludes low-quality bases.
- AD refers to the allele depth. AD reports the informative reads supporting each allele. AD may not always sum to DP.
MQ (Mapping quality)
- MQ refers to the root mean square (RMS) mapping quality of all the reads spanning the given variant site.
- MQ represents the square root of the mean of squares of mapping qualities of all the reads at a given variant site.
- The MQ >= 60 represents the good mapping quality. The variants with MQ < 40 or < 50 should be removed.
FS (FisherStrand) and SOR (StrandOddsRatio)
- FS and SOR tags used for strand bias evaluation
- FS refers to the Phred-scaled probability of the strand bias. FS values close to zero represents little to no bias at the variant site.
- SOR is created as an alternative to FS. Most of the SOR values range from 0 to 9. The SOR values greater than 3 shows strand bias and should be removed.
QD (Quality by Depth)
- QD is variant confidence adjusted for variant sites with deep coverages.
- QD is a better metric than DP or QUAL for variant filtering.
- Variants with QD < 2 should be removed.
DS (Alternate allele dosage)
- Expected probability of the alternate allele
- Calculated as
p(heterozygous) + 2*p(homozygous alternate)
AC (Alternate allele count)
- Total alternate allele count for all possible genotypes
AN (Total allele count)
- Total number of alleles in all possible genotypes
AF (Alternate allele frequency)
- AF is the frequency for an alternate allele
- AF is calculated (AC/AN)
- AF tag can be used to infer the minor allele frequency (MAF) (Check bcftools
fill-tagsplugin) - If AF < 0.5, then AF is equal to MAF
- rare variants generally has AF or MAF < 5 % (0.05)
MAF (Minor allele frequency)
- MAF refers to the minor allele (least frequent) frequency
- An alternate allele may not be always minor allele
AR2 (Allelic R-Squared) and DR2 (Dosage R-Squared)
- DR2 and AR2 fields estimate SNP imputation accuracy for each SNP. DR2 and AR2 are highly correlated.
- Allelic R-Squared refers to the squared correlation between the imputed most probable allele dosage and true allele dosage
- Values between 0.3 and 0.8 are typically used for filtering i.e. variant should be retained if the average accuracy of imputation > 0.3 or > 0.8
- R-Squared measures are highly correlated with minor allele frequency (MAF)
NS (Samples with data)
- NS refers to the number of target samples which has called genotypes or does not have missing values
RPB (Read Position Bias)
- RPB refers to the tail distance bias between reference and alternate allele by the mapped reads
- Most of the time, the end of the sequences constitutes sequencing errors, and therefore the alleles present at the end of sequences may not be right.
- RPB is a z-score for Mann-Whitney U test. RPB > 2 and < -2 (p < 0.05) indicate significant bias. RPB value close to zero is ideal (p > 0.05). The bigger p value is better.
MQB (Mapping Quality Bias)
- MQB refers to the mapping quality bias between the reads supporting reference and alternate allele
- MQB reports the p values from the Mann-Whitney U test. If p < 0.05, it suggests there is significant bias i.e. the reads supporting alternate allele have lower mapping quality than reads supporting reference allele. The bigger p value is better.
VDB (Variant Distance Bias)
- VDB refers to the variant distance bias which evaluates the likelihood of the mean pairwise distance of the variant bases in the mapped region of the reads.
- VDB checks for the random distribution of variant bases in the mapped region of the reads. The lower value suggests that the position of alternate allele is biased. The higher value is the better.
- VDB is useful in identifying the false-positive variants (artifacts resulted from mis-aligned regions such as RNA-seq reads spanning the splice sites).
Enhance your skills with courses on genomics and bioinformatics
- Genomic Data Science Specialization
- Biology Meets Programming: Bioinformatics for Beginners
- Python for Genomic Data Science
- Bioinformatics Specialization
- Command Line Tools for Genomic Data Science
References
- The Variant Call Format (VCF) Version 4.2 Specification
- Nyman S, Duchemin SI, de Koning DJ, Berglund B. Genome-wide association study of normal and atypical progesterone profiles in Holstein-Friesian dairy cows. Journal of dairy science. 2019 Apr 1;102(4):3204-15.
- Hard-filtering germline short variants
- Gilly, A. L. (2019). Sequencing in Isolation: Next-generation sequencing studies in founder populations (Doctoral thesis). https://doi.org/10.17863/CAM.40557
- Bomba L, Walter K, Soranzo N. The impact of rare and low-frequency genetic variants in common disease. Genome biology. 2017 Dec;18(1):1-7.
- Clevenger J, Chavarro C, Pearl SA, Ozias-Akins P, Jackson SA. Single nucleotide polymorphism identification in polyploids: a review, example, and recommendations. Molecular plant. 2015 Jun 1;8(6):831-46.
- Calling SNPs/INDELs with SAMtools/BCFtools
- Danecek P, Nellåker C, McIntyre RE, Buendia-Buendia JE, Bumpstead S, Ponting CP, Flint J, Durbin R, Keane TM, Adams DJ. High levels of RNA-editing site conservation amongst 15 laboratory mouse strains. Genome biology. 2012 Apr;13(4):1-2.
- Browning BL, Browning SR. A unified approach to genotype imputation and haplotype-phase inference for large data sets of trios and unrelated individuals. The American Journal of Human Genetics. 2009 Feb 13;84(2):210-23.
- Allele Depth (AD) is lower than expected
If you have any questions, comments or recommendations, please email me at reneshbe@gmail.com
This work is licensed under a Creative Commons Attribution 4.0 International License
Some of the links on this page may be affiliate links, which means we may get an affiliate commission on a valid purchase. The retailer will pay the commission at no additional cost to you.

