Venn diagrams in Python and R
What is Venn diagram?
- Sets of shapes especially circles to represent the logical relationships among two or more variables or datasets
- Venn diagrams are useful to identify the shared and unique elements belonging to each variable or datasets For example, in genomics experiments Venn diagrams are useful to identify the shared and unique genes among different conditions
Create Venn diagrams using Python
- We will use
bioinfokit v0.6or later - Check bioinfokit documentation for installation and usage
Plot 2 and 3-way Venn diagrams using bioinfokit
>>>from bioinfokit import visuz
# Read documentation at https://github.com/reneshbedre/bioinfokit
# 3-way Venn
>>>visuz.venn(vennset=(1,1,1,1,1,1,1))
# note: order the set in (100,010,110,001,101,011,111) format

# 2-way venn
>>>visuz.venn(vennset=(1,1,1))
# note: order the set in (111,100,010,001,110,101,011) format
Generated Venn plots by above code,
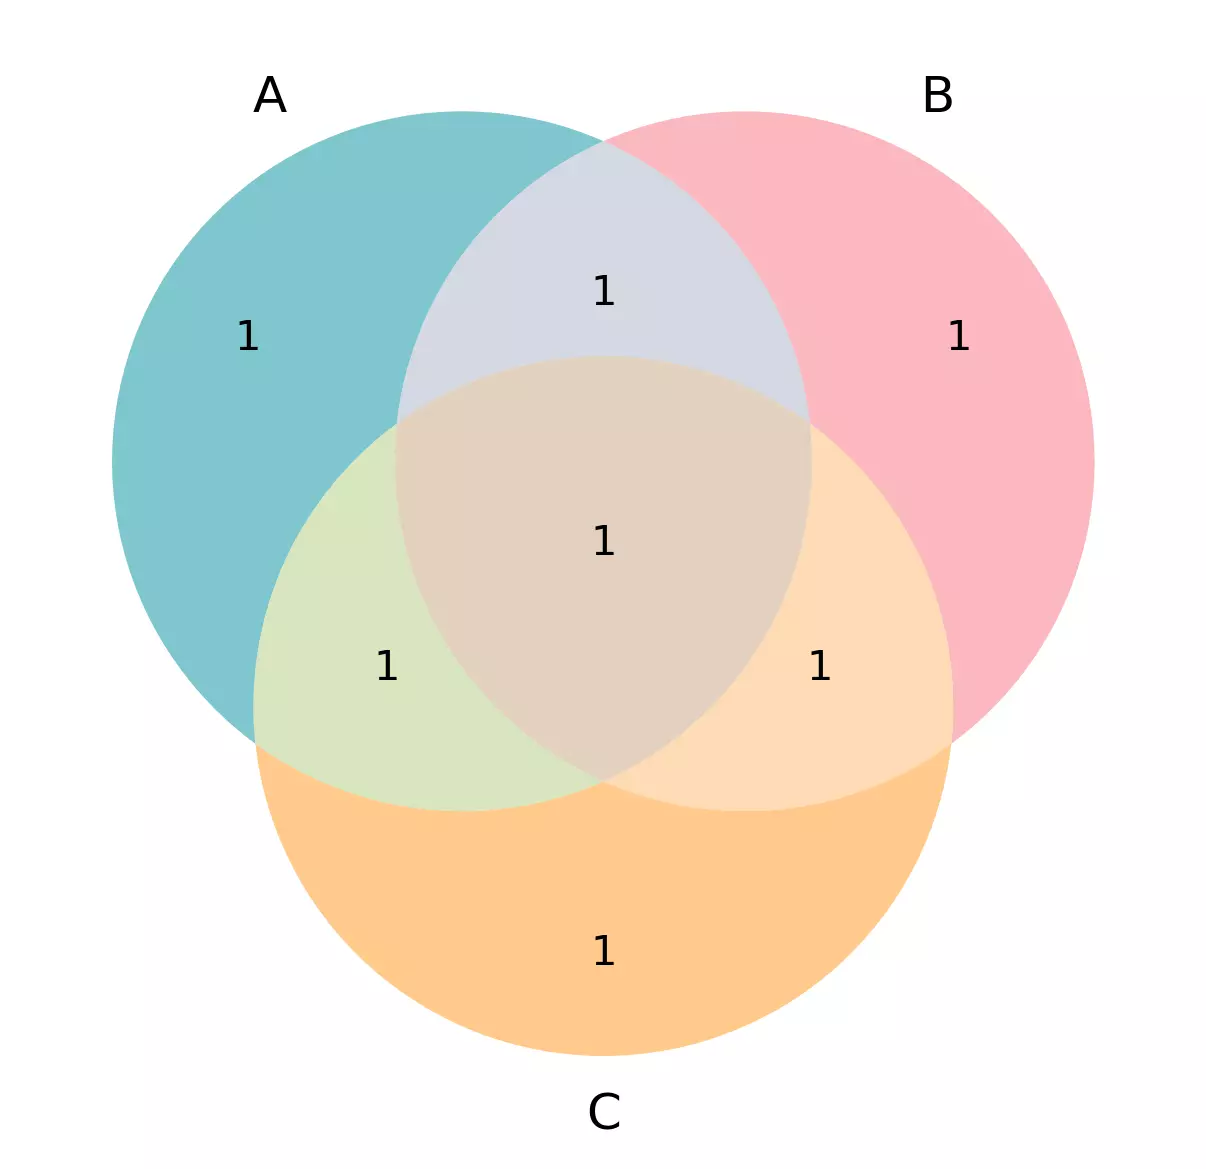
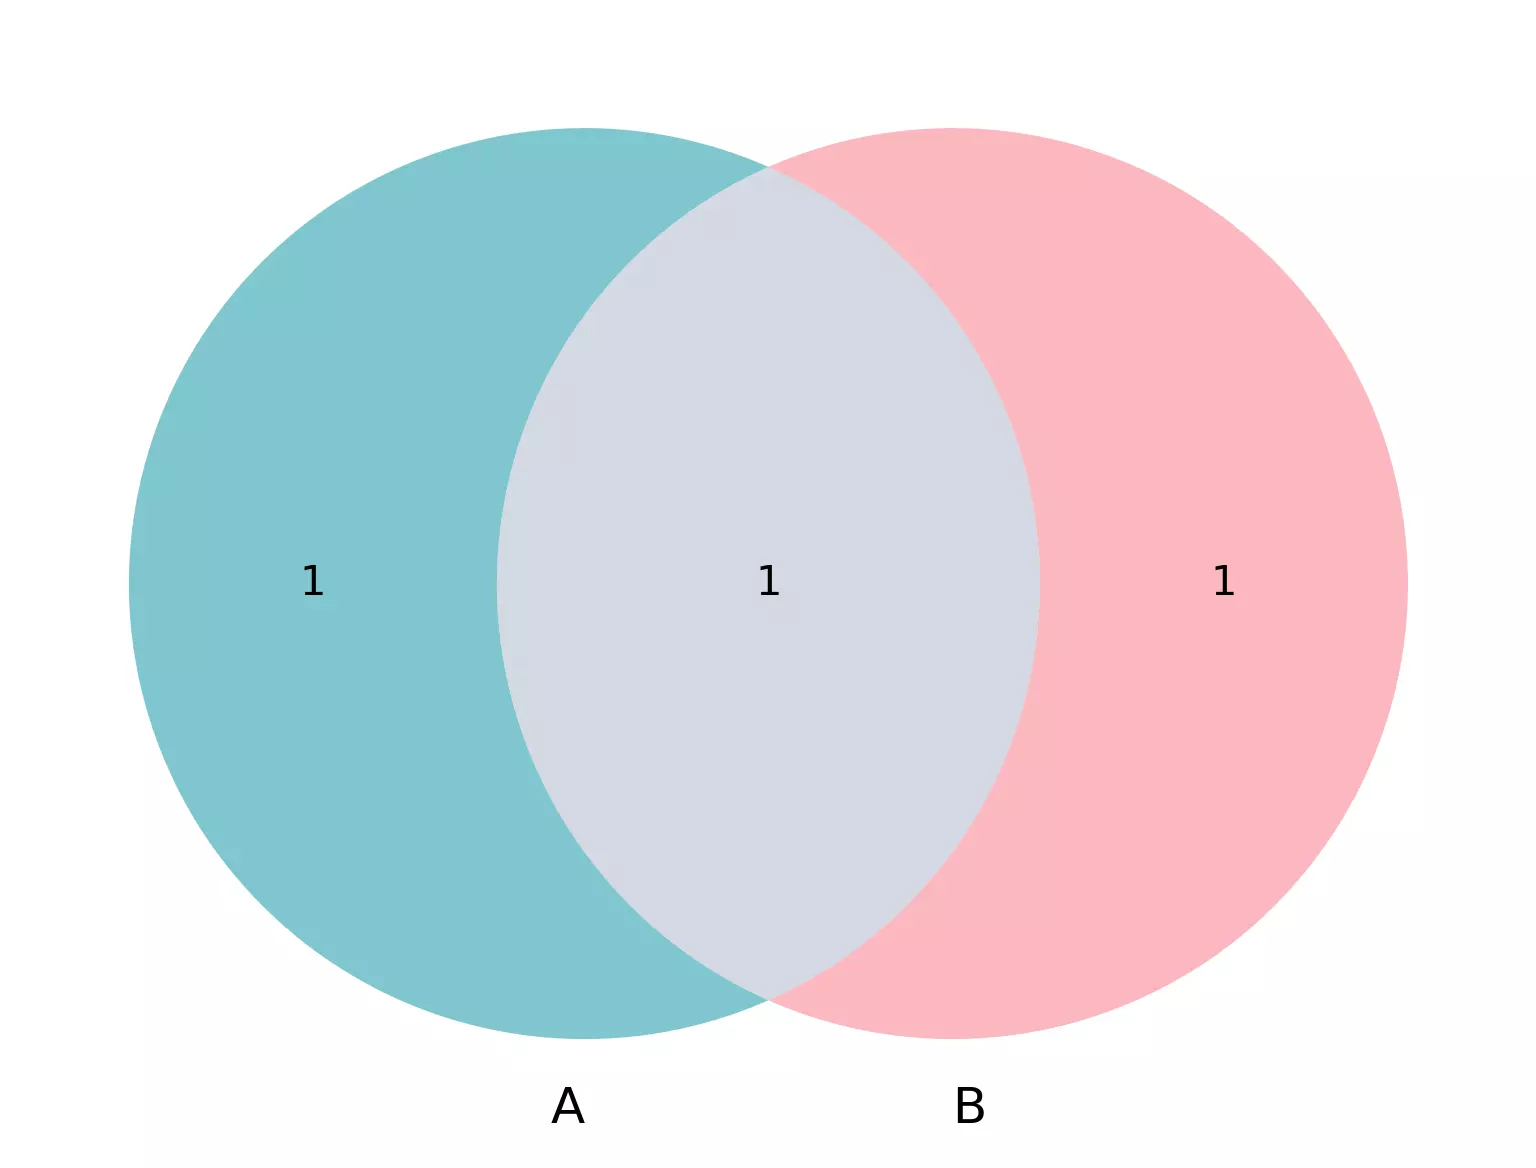
With changes in default parameters for sets, and color, and labels
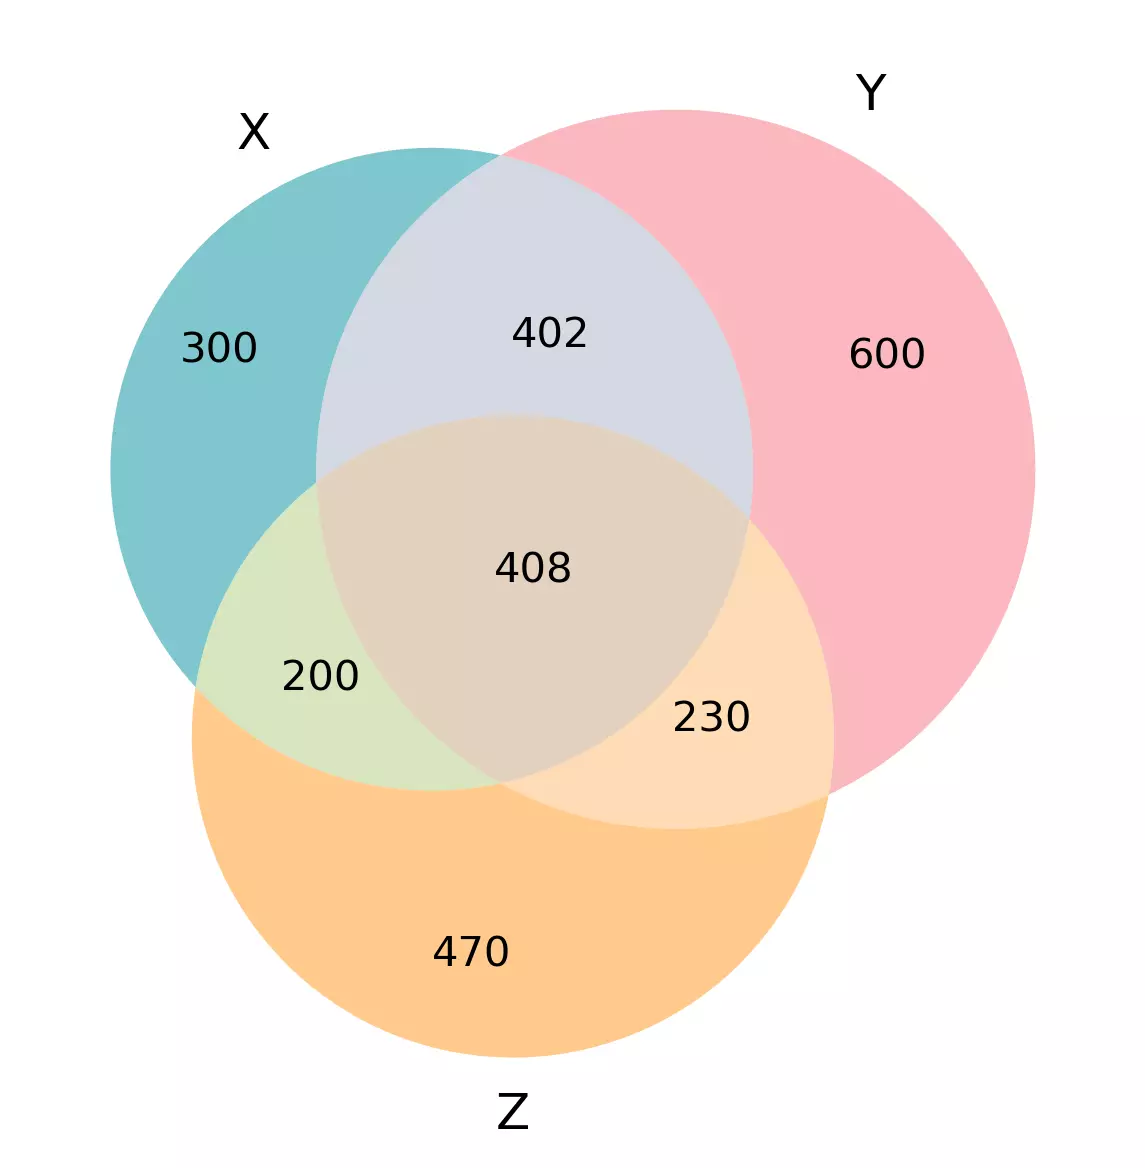
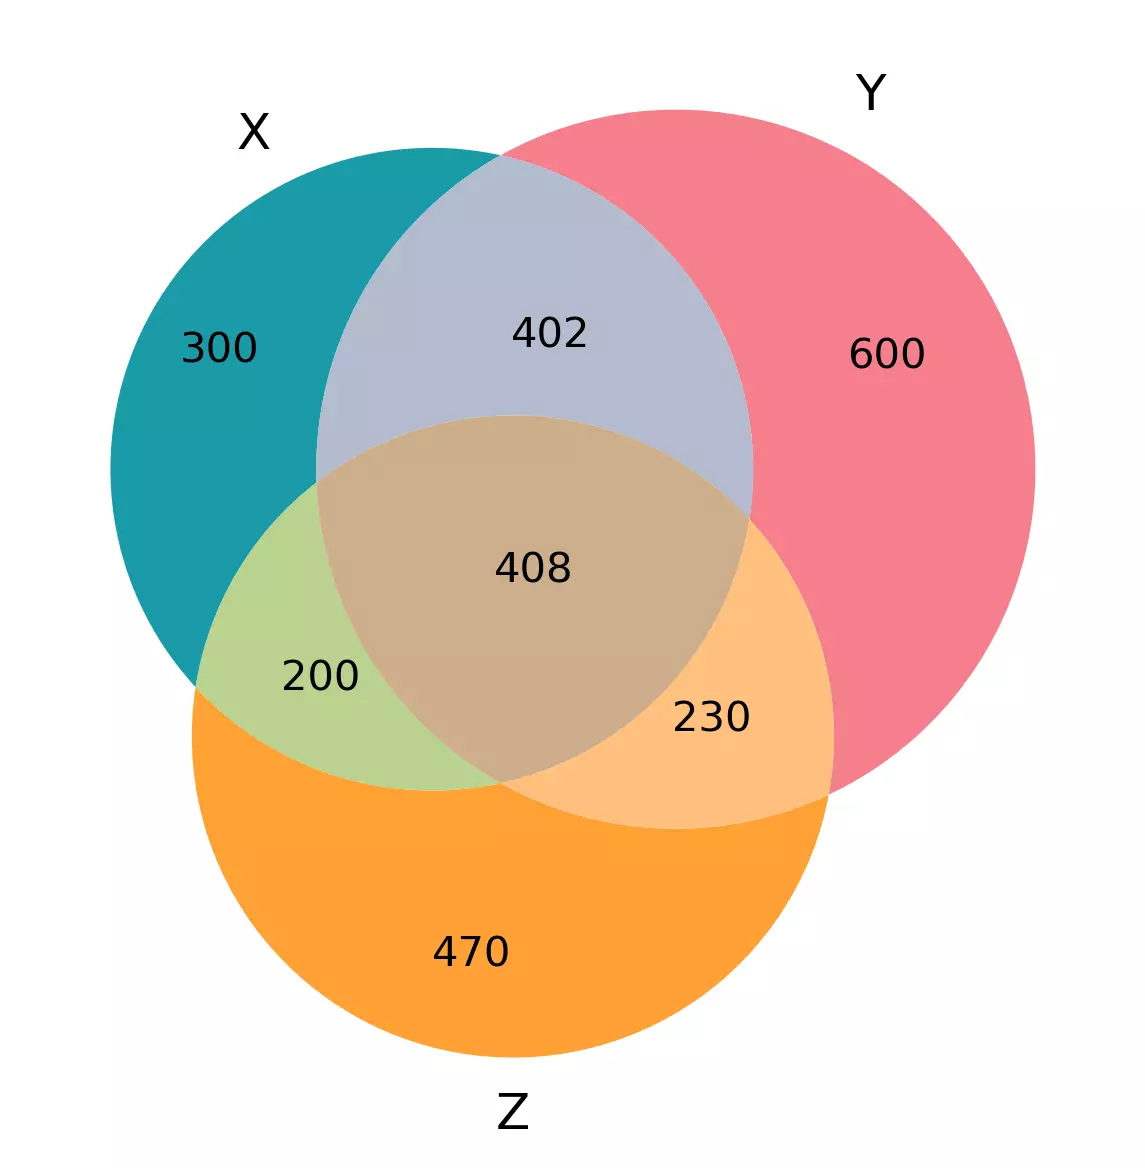
>>>visuz.venn(vennset=(300,600,402,470,200,230,408), vennlabel=("X", "Y", "Z"))
# note: order the set in (100,010,110,001,101,011,111) format
# change default color
# check for more colors at https://www.webucator.com/blog/2015/03/python-color-constants-module/
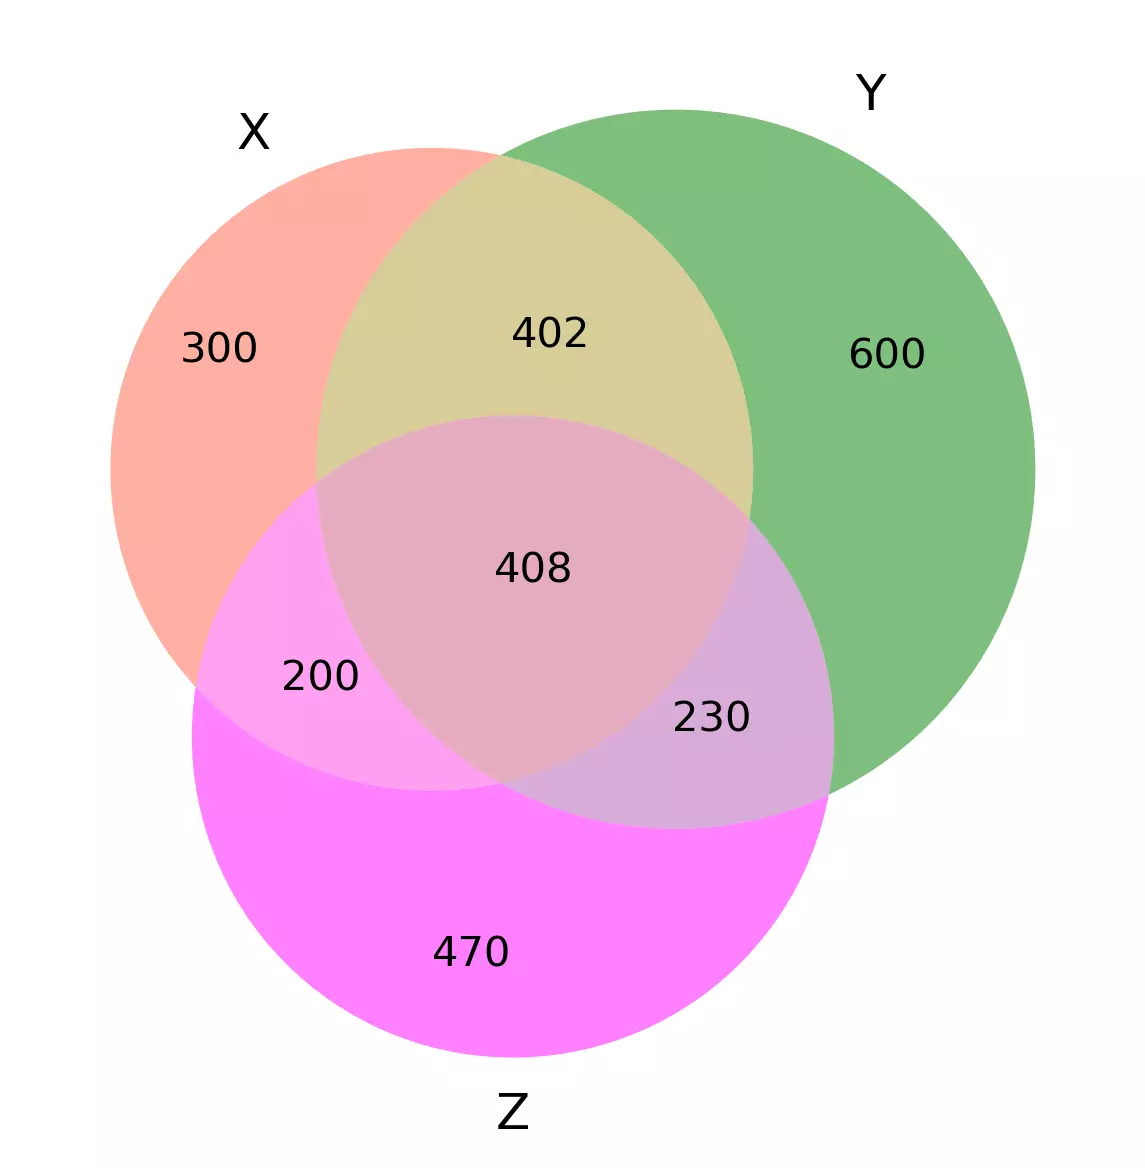
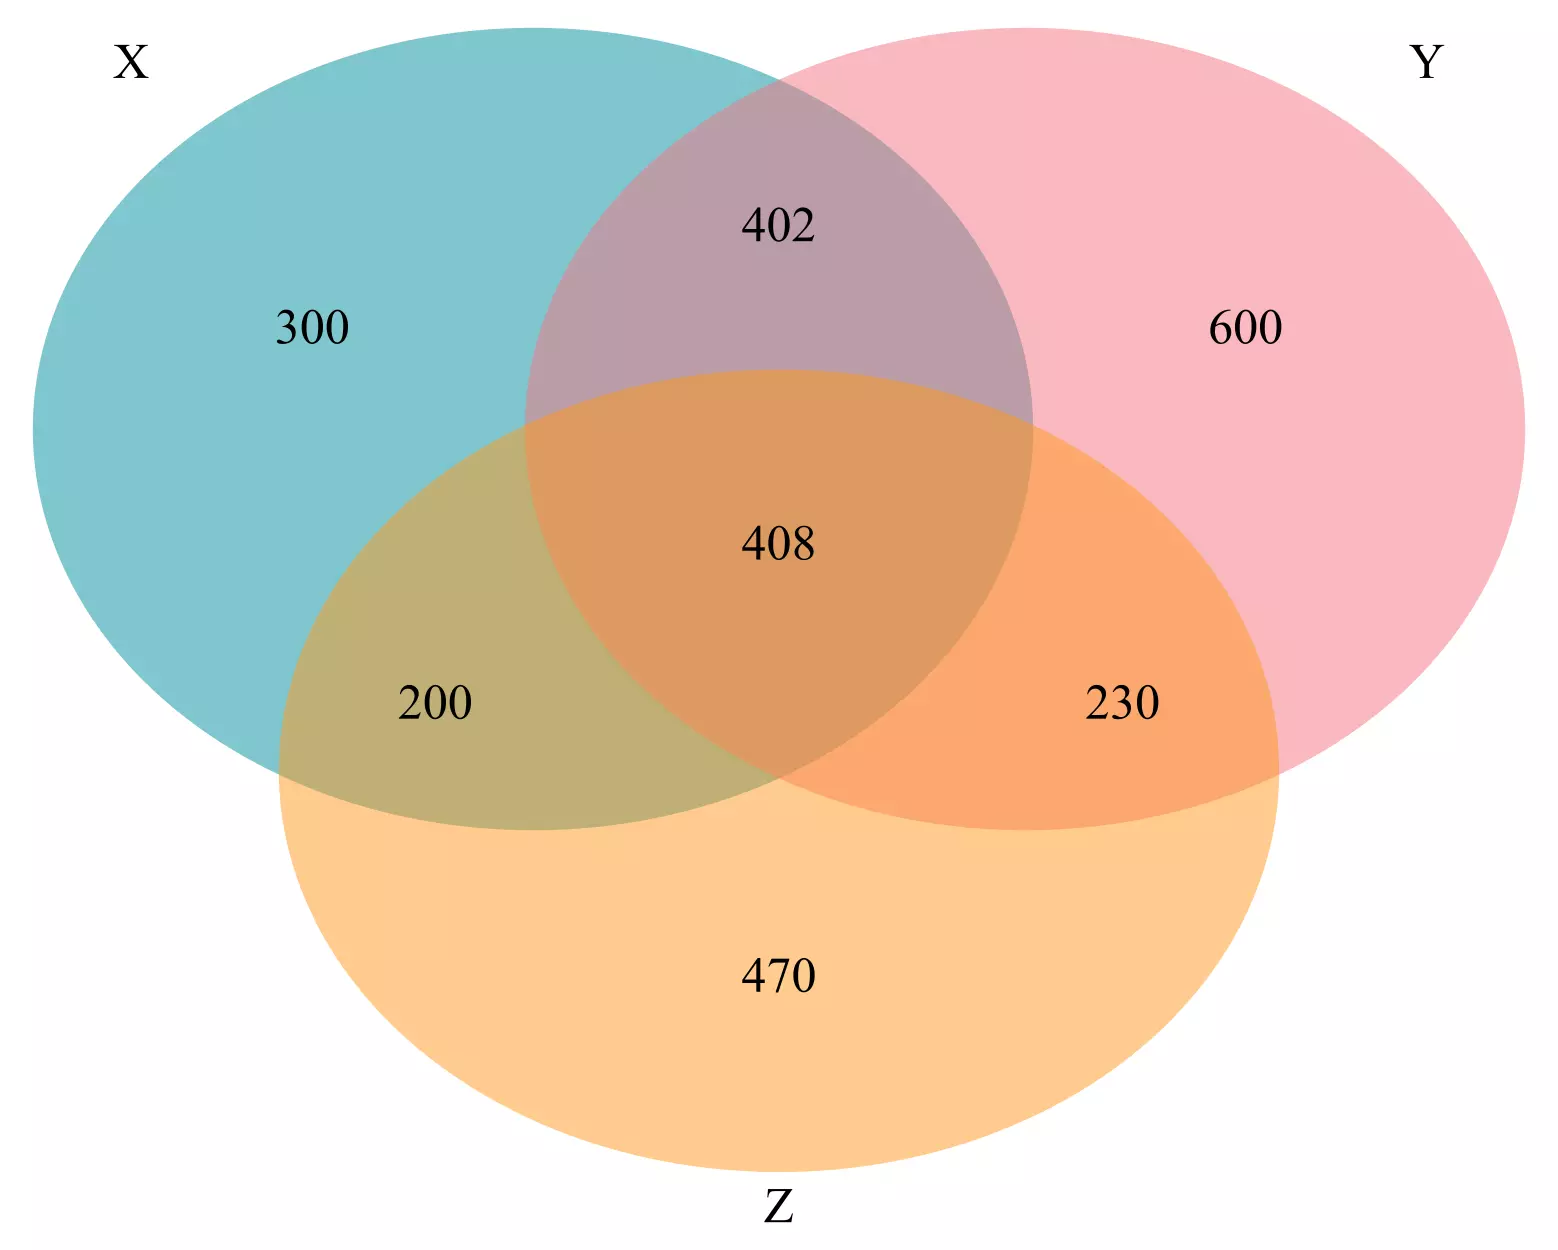
>>>visuz.venn(vennset=(300,600,402,470,200,230,408), vennlabel=("X", "Y", "Z"), venncolor=('#ff6347', '#008000', '#FF00FF'))
With changes in default parameters for transparency
>>>visuz.venn(vennset=(300,600,402,470,200,230,408), vennlabel=("X", "Y", "Z"), vennalpha=0.9)
# note: order the set in (100,010,110,001,101,011,111) format
# 2-way venn
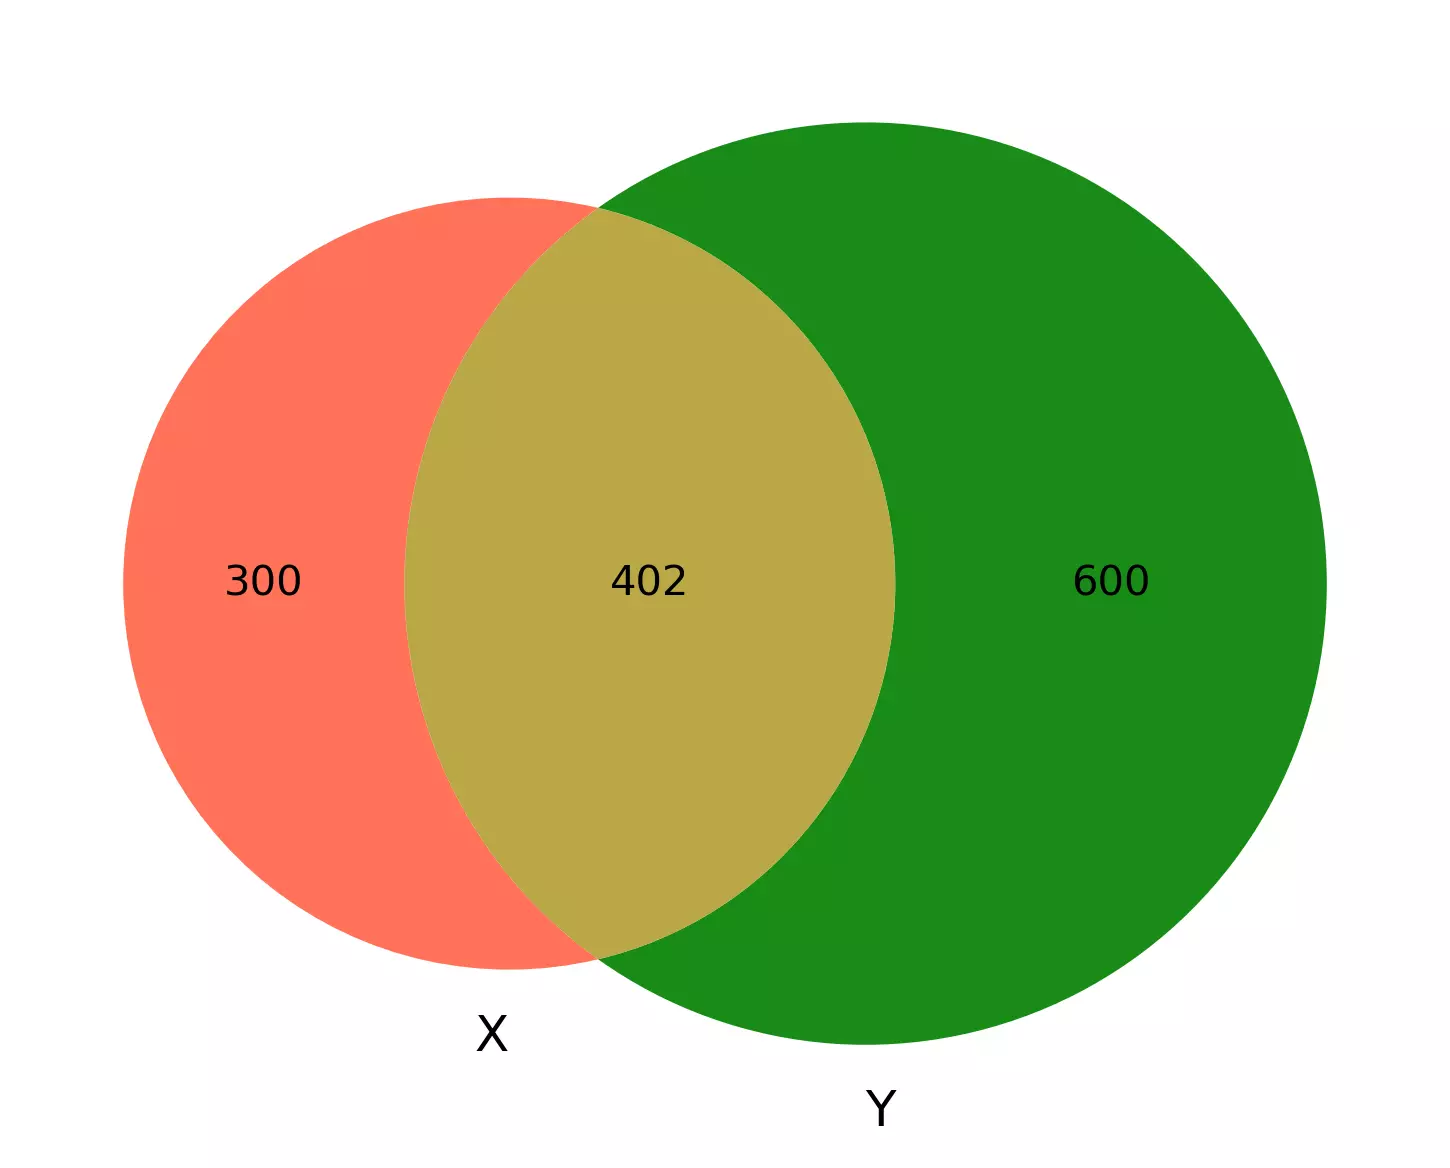
>>>visuz.venn(vennset=(300,600,402), vennlabel=("X", "Y"), venncolor=('#ff6347', '#008000'), vennalpha=0.9)
# note: order the set in (10,01,11) format
Create Venn diagrams using R
- We will use
VennDiagram (v1.6.20) - Check VennDiagram documentation for usage
Three-way Venn diagram
# install as install.packages('VennDiagram')
library(VennDiagram)
draw.triple.venn(area1=1310, area2=1640, area3=1308, n12=810, n23=638, n13=608,n123=408,
                 category=c('X', 'Y', 'Z'),  # label for each circle
                 fill=c('#00909e', '#f67280', '#ff971d'), # color for each circle
                 lwd=c(0,0,0)  # line width for each circle
                  )
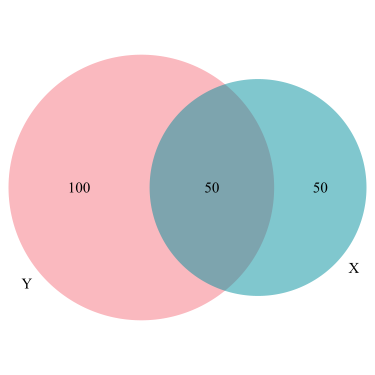
Two-way Venn diagram
draw.pairwise.venn(area1=100, area2=150, cross.area=50,
                 category=c('X', 'Y'),  # label for each circle
                 fill=c('#00909e', '#f67280'), # color for each circle
                 lwd=c(0,0)  # line width for each circle
                  )
References
- https://github.com/konstantint/matplotlib-venn
- Chen H, Boutros PC. VennDiagram: a package for the generation of highly-customizable Venn and Euler diagrams in R. BMC bioinformatics. 2011 Dec;12(1):1-7.
This work is licensed under a Creative Commons Attribution 4.0 International License

