How to Compute Trimmed Mean in R?
Trimmed mean is an arithmetic mean which is calculated by removing the specific percentages of the largest and smallest values from the sample. The trimmed mean is also known as the truncated mean.
A 10% trimmed mean is calculated using the remaining 80% of data after removing 10% of the largest and smallest values.
Trimmed mean is a robust measure of central tendency and removes the effect of erratic observations such as outliers.
The trimmed mean could be calculated by removing the 5%, 10%, 20%, etc. largest and smallest values from the sample.
In R, trimmed mean can be calculated for vector, data frame, and matrix using various functions such as mean() and
describe().
The syntax for the mean() function to calculate the trimmed mean is,
# calculate 5% trimmed mean
mean(x, trim = 0.05)
# calculate 10% trimmed mean
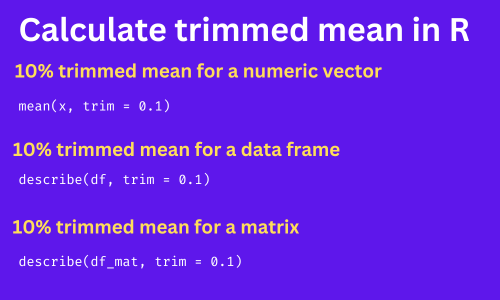
mean(x, trim = 0.1)
In the above function, x is an object which could be a numeric vector or data frame column. The trim parameter
is used for calculating certain percentages of the trimmed mean.
If trim = 0 (default value), the mean() function returns the arithmetic mean of the x.
The following examples illustrate how to calculate the trimmed mean using mean() and describe() functions.
1. Compute trimmed mean for a vector
The following example shows how to calculate the 5% trimmed mean on a numeric vector. If you have a character or alphanumeric
vector, it will return NA.
# create a random numeric vector
x <- c(1, 2, 4, 10, 4, 5, 0.5, 8)

# calculate 5% trimmed mean
mean(x, trim = 0.05)
4.3125
The 5% trimmed mean is 4.3125 after removing 5% largest and smallest values from the vector.
In addition, to the mean() function, you can also use describe() function (from the psych package) to calculate the
trimmed mean of a vector. By default, it calculates the 10% trimmed mean.
# create a random numeric vector
x <- c(1, 2, 4, 10, 4, 5, 0.5, 8)

# load package
library(psych)

# calculate 10% trimmed mean
describe(x)

   vars n mean   sd median trimmed  mad min max range skew kurtosis   se
X1    1 8 4.31 3.33      4    4.31 3.71 0.5  10   9.5 0.44    -1.38 1.18

# calculate 20% trimmed mean
describe(x, trim = 0.2)

   vars n mean   sd median trimmed  mad min max range skew kurtosis   se
X1    1 8 4.31 3.33      4       4 3.71 0.5  10   9.5 0.44    -1.38 1.18
The 10% trimmed mean is 4.31 and the 20% trimmed mean is 3.71.
2. Calculate the trimmed mean for a data frame
The following example shows how to calculate the trimmed mean for specific columns or all columns of a data frame.
# load example dataset
df <- read.table("https://reneshbedre.github.io/assets/posts/anova/onewayanova.txt",
                 header = TRUE)

# view data frame
df
   A  B  C  D
1 25 45 30 54
2 30 55 29 60
3 28 29 33 51
4 36 56 37 62
5 29 40 27 73

# calculate 10% trimmed mean for column A
mean(df$A, trim = 0.1)
29.6
The 10% trimmed mean for an A column is 29.6.
You could also use describe() function to get the trimmed mean for all columns at once. For example, calculate the 10%
trimmed mean for all columns for a following example data frame
# load example dataset
df <- read.table("https://reneshbedre.github.io/assets/posts/anova/onewayanova.txt",
                 header = TRUE)

# view data frame
df
   A  B  C  D
1 25 45 30 54
2 30 55 29 60
3 28 29 33 51
4 36 56 37 62
5 29 40 27 73

# load package
library(psych)

# calculate 10% trimmed mean for all columns
describe(df)

  vars n mean    sd median trimmed   mad min max range  skew kurtosis   se
A    1 5 29.6  4.04     29    29.6  1.48  25  36    11  0.49    -1.39 1.81
B    2 5 45.0 11.20     45    45.0 14.83  29  56    27 -0.27    -1.85 5.01
C    3 5 31.2  3.90     30    31.2  4.45  27  37    10  0.39    -1.72 1.74
D    4 5 60.0  8.51     60    60.0  8.90  51  73    22  0.41    -1.61 3.81
The trimmed column shows the 10% trimmed mean for all columns in a data frame.
3. Calculate the trimmed mean for a matrix
The describe() function could be used for calculating the trimmed mean on matrix.
The following examples show how to calculate the trimmed mean on the matrix,
# load package
library(psych)

# load example dataset
df <- read.table("https://reneshbedre.github.io/assets/posts/anova/onewayanova.txt",
                 header = TRUE)

# convert to matrix
df_mat = data.matrix(df)

# get summary statistics
describe(df_mat)

  vars n mean    sd median trimmed   mad min max range  skew kurtosis   se
A    1 5 29.6  4.04     29    29.6  1.48  25  36    11  0.49    -1.39 1.81
B    2 5 45.0 11.20     45    45.0 14.83  29  56    27 -0.27    -1.85 5.01
C    3 5 31.2  3.90     30    31.2  4.45  27  37    10  0.39    -1.72 1.74
D    4 5 60.0  8.51     60    60.0  8.90  51  73    22  0.41    -1.61 3.81
The trimmed column shows the 10% trimmed mean for all columns in a matrix.
Enhance your skills with statistical courses using R
- Statistics with R Specialization
- Data Science: Foundations using R Specialization
- Data Analysis with R Specialization
- Understanding Clinical Research: Behind the Statistics
- Introduction to Statistics
- R Programming
- Getting Started with Rstudio
This work is licensed under a Creative Commons Attribution 4.0 International License
Some of the links on this page may be affiliate links, which means we may get an affiliate commission on a valid purchase. The retailer will pay the commission at no additional cost to you.

