How to Calculate VIF in R
What is Variance Inflation Factor (VIF)?
Variance inflation factor (VIF) is a most commonly used metric for measuring the degree of multicollinearity in the regression model.
Multicollinearity refers to the existence of a high correlation between two or more independent variables in the regression model.
Multicollinearity is problematic in the regression as it leads to a biased and unstable estimation of regression coefficients, increases the variance and standard error of regression coefficients, and decreases the statistical power.
How to interpret VIF?
The VIF value ranges from +1 to the positive infinity. The VIF value of 1 indicates a complete absence of multicollinearity.
The following VIF ranges are mostly used for assessing the moderate to the severity of multicollinearity,

Note: There is no universally accepted range for VIF values for multicollinearity detection. It is advisable to have VIF < 2.
How to calculate VIF in R?
We will use the blood pressure example dataset for calculating the VIF in R. This dataset contains
Age, weight, BSA, Dur, pulse, and Stress predictors (independent variables) and BP as response variable
(dependent variable).
In this example, our goal is to calculate VIF and to check if there is multicollinearity exists within the six predictor variables.
# load dataset
df = read.csv("https://reneshbedre.github.io/assets/posts/reg/bp.csv")

# view first few rows
head(df)
    BP Age Weight  BSA  Dur Pulse Stress
1  105  47   85.4 1.75  5.1    63     33
2  115  49   94.2 2.10  3.8    70     14
3  116  49   95.3 1.98  8.2    72     10
4  117  50   94.7 2.01  5.8    73     99
5  112  51   89.4 1.89  7.0    72     95
6  121  48   99.5 2.25  9.3    71     10
Fit the multiple regression model,
# fit the regression model
model <- lm(BP ~ Age + Weight + BSA + Dur + Pulse + Stress, data = df)

# get the F statistics and performance metrics
summary(model)$fstatistic[1]
  value
560.641

summary(model)$r.squared
0.9961

summary(model)$adj.r.squared
0.9943
The higher F value suggests that there is a significant relationship between the predictor variables and the response
variable (BP).
The higher adjusted R-Squared (0.9943) also suggests that the fitted model has better performance and explains most of the variation in the response variable that can be explained by predictor variables.
Now, we will calculate the VIF to check whether there is multicollinearity exists among the predictor variables.
In R, VIF can be calculated using the vif()
function (from the car package).
# load package
library(car)

# calculate VIF for each predictor variable from fitted model
vif(model)

     Age   Weight      BSA      Dur    Pulse   Stress
1.762807 8.417035 5.328751 1.237309 4.413575 1.834845
The VIF values for weight, BSA, and pulse are high (VIF > 2) and suggest that these variables are highly
correlated with some predictor variables in the model. It means that there is multicollinearity exists among the
predictor variables.
How to remove variables causing multicollinearity?
To check which variables are highly correlated and causing the multicollinearity, you can perform the pairwise correlation analysis for predictor variables.
You can use the cor() function to perform the pairwise correlation analysis using a data frame.
# pairwise correlation analysis
# exclude response variable (BP)
cor(df[ , -1])

            Age     Weight        BSA       Dur     Pulse     Stress
Age    1.0000000 0.40734926 0.37845460 0.3437921 0.6187643 0.36822369
Weight 0.4073493 1.00000000 0.87530481 0.2006496 0.6593399 0.03435475
BSA    0.3784546 0.87530481 1.00000000 0.1305400 0.4648188 0.01844634
Dur    0.3437921 0.20064959 0.13054001 1.0000000 0.4015144 0.31163982
Pulse  0.6187643 0.65933987 0.46481881 0.4015144 1.0000000 0.50631008
Stress 0.3682237 0.03435475 0.01844634 0.3116398 0.5063101 1.00000000
Visualize the pairwise correlation using corplot() function from corrplot R package,
# load package
library(corrplot)

# visualize pairwise correlation
corrplot(cor(df[ , -1]), type = "upper")
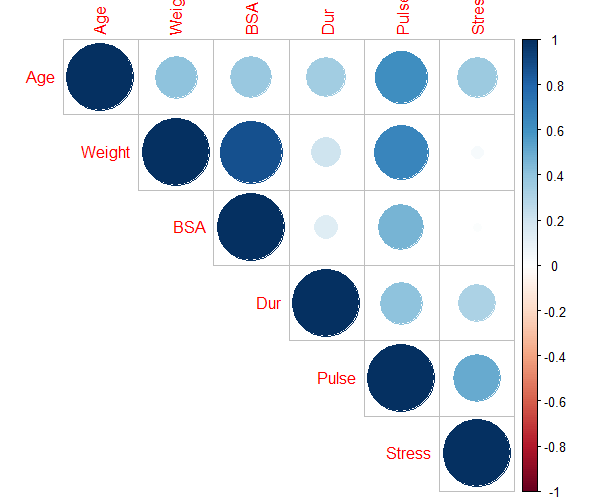
The pairwise correlation suggests,
Weightis highly correlated withBSA(r > 0.8) andPulse(r > 0.6)Pulseis highly correlated withAge(r > 0.6)
Based on VIF and pairwise correlation analysis, we can remove the BSA and Pulse variables to remove the
potential multicollinearity among the predictor variables.
Now, re-fit the regression model with the new dataset (after removing BSA and Pulse variables) and check if there is
multicollinearity exists among the predictor variables.
As per pairwise correlation analysis, Weight is highly correlated with BSA (r > 0.8) and Pulse (r > 0.6). We will
drop the BSA and Pulse variables from regression model.
# get new dataset
df_new <- df[, c("BP", "Age","Weight", "Dur", "Stress")]

# fit the regression model
model <- lm(BP ~ Age + Weight +  Dur + Stress, data = df_new)

# calculate VIF
vif(model)

     Age   Weight      Dur   Stress
1.468245 1.234653 1.200060 1.241117
As you can see, in the updated regression model, there is no strong multicollinearity among the predictor variables.
Hence, these four variables could be used as predictor variables in regression analysis. This process of selection of appropriate variables is also known as feature selection.
How to fix multicollinearity?
- Increase the sample size
- Remove variables causing multicollinearity
- Combine the highly correlated predictor variables
Enhance your skills with statistical courses using R
- Statistics with R Specialization
- Data Science: Foundations using R Specialization
- Data Analysis with R Specialization
- Understanding Clinical Research: Behind the Statistics
- Introduction to Statistics
- R Programming
- Getting Started with Rstudio
References
- Vatcheva KP, Lee M, McCormick JB, Rahbar MH. Multicollinearity in regression analyses conducted in epidemiologic studies.
Epidemiology (Sunnyvale, Calif.). 2016 Apr;6(2). - Daoud JI. Multicollinearity and regression analysis. InJournal of Physics: Conference Series 2017 Dec 1 (Vol. 949, No. 1, p. 012009). IOP Publishing.
- Detecting Multicollinearity Using Variance Inflation Factors
This work is licensed under a Creative Commons Attribution 4.0 International License
Some of the links on this page may be affiliate links, which means we may get an affiliate commission on a valid purchase. The retailer will pay the commission at no additional cost to you.

