Q-Q plot in R
The Q-Q plot (Quantile-Quantile plot) is a graphical tool that compares observed quantiles of the sample data to the expected quantiles of the theoretical distribution (e.g. normal distribution).
The purpose of the Q-Q plot is to check whether the given dataset follows a normal distribution (or other theoretical distribution).
If the sample data is from normal distribution, you should see sample quantiles follows the normal quantiles in a straight line (also known as reference line).

R provides a number of functions for creating QQ plots. Here’s a detailed examples on how to create a Q-Q plot in R using various functions.
qqPlot() from EnvStats package
The qqPlot() function from EnvStats package can be used for creating Q-Q plot as below,
# generate random dataset with approximate normal distribution
data = rnorm(50, mean = 60, sd = 10)

# create QQ plot
# load package
library(EnvStats)

# QQ plot
qqPlot(data, add.line = TRUE, line.col = 2, line.lwd = 1.5)
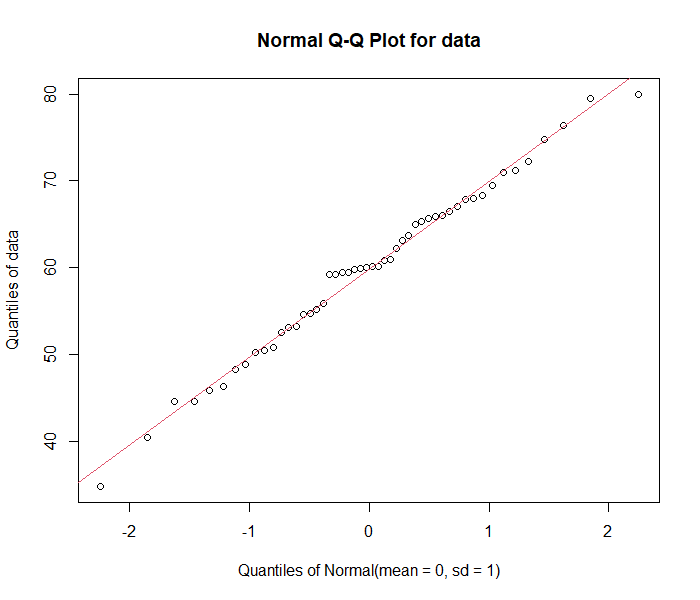
As the observed quantiles of sample data follows the reference line, we conclude that the sample dataset follows a normal distribution.
qqnorm() from base R
qqnorm() and qqline() functions can also be used for creating Q-Q plot
# generate random dataset with approximate normal distribution
data = rnorm(50, mean = 60, sd = 10)

# create QQ plot
qqnorm(data, xlab = "Theoretical Quantiles (mean = 0, sd = 1)")
# add reference line
qqline(data, col = "red", lwd = 1.5)
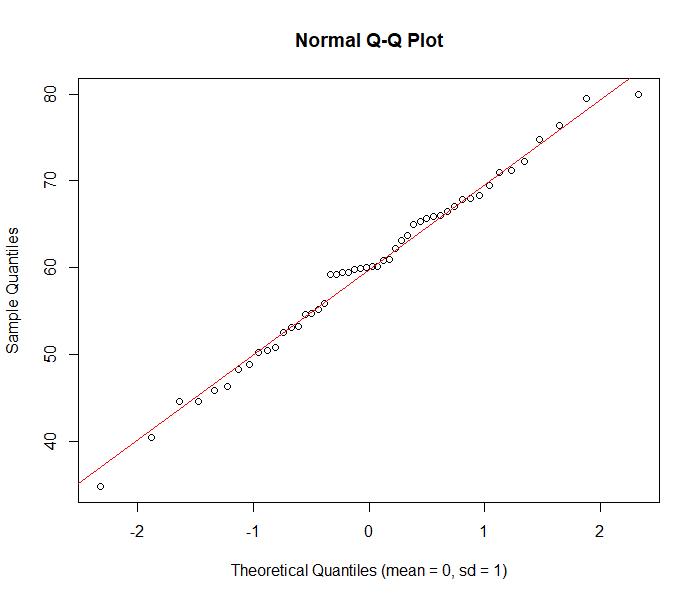
As the observed quantiles of sample data follows the reference line, we conclude that the sample dataset follows a normal distribution.
qqPlot() from car package
# generate random dataset with approximate normal distribution
data = rnorm(50, mean = 60, sd = 10)

# create QQ plot
# load package
library(car)

# QQ plot
qqPlot(data, xlab = "Theoretical Quantiles (mean = 0, sd = 1)", ylab = "Sample Quantiles")
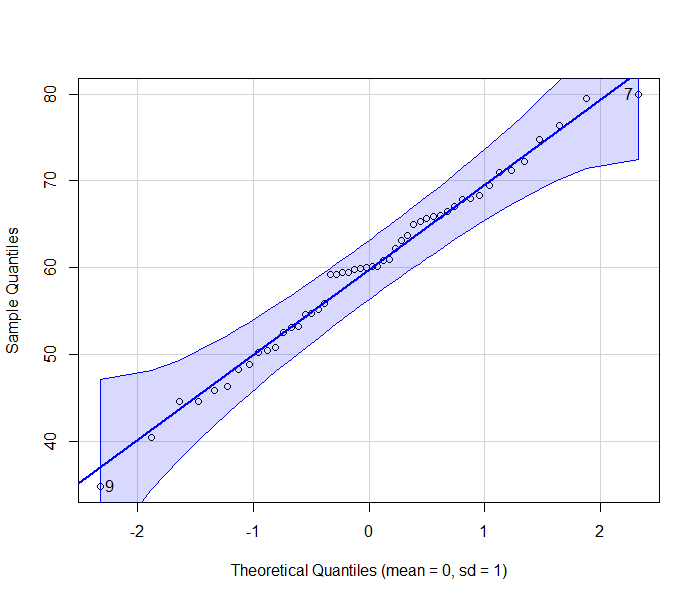
As the observed quantiles of sample data follows the reference line, we conclude that the sample dataset follows a normal distribution.
The Q-Q plot is widely used to verify the assumption of normality in hypothesis testing (e.g. ANOVA, t-test, etc.).
In addition to Q-Q plot, the assumption of normality should also be assessed using the statistical test such as Shapiro-Wilk test
Enhance your skills with courses on Statistics and R
- Introduction to Statistics
- R Programming
- Data Science: Foundations using R Specialization
- Data Analysis with R Specialization
- Getting Started with Rstudio
- Applied Data Science with R Specialization
- Statistical Analysis with R for Public Health Specialization
This work is licensed under a Creative Commons Attribution 4.0 International License
Some of the links on this page may be affiliate links, which means we may get an affiliate commission on a valid purchase. The retailer will pay the commission at no additional cost to you.

