Shapiro–Wilk Test in R
The normal distribution (also known as the Gaussian distribution) is one of the crucial assumption for performing parametric tests such as ANOVA, t-test, regression, and many others.
The Shapiro-Wilk test is used for assessing whether a dataset follows a normal distribution. This test helps to check the assumption of normality.
The Shapiro-Wilk test analyzes the null hypothesis (H0: data comes from a normally distributed population against the alternative Hypothesis (H1: data does not come from a normally distributed population).
To perform the Shapiro-Wilk test of normality in R, you can use the shapiro.test() function.
The syntax for shapiro.test() function looks like this:
shapiro.test(data)
Where, data is a numeric vector
Example of Shapiro-Wilk test in R
The following examples demonstrate how to use shapiro.test() function for testing the normality assumption in R.
Suppose, we have the following student weight data and would like to check whether this dataset follows normal distribution.
Sample size: Shapiro-Wilk test can be applied on dataset with sample size in between 3 to 5000.
# generate random data for student weights
data = rnorm(50, mean = 70, sd = 10)

# perform Shapiro–Wilk Test
shapiro.test(data)

# output
	Shapiro-Wilk normality test

data:  data
W = 0.93457, p-value = 0.4943
The p value is greater than significance level of 0.05 (W = 0.9345, p = 0.4943) for student weight data. Hence, we fail to reject the null hypothesis and conclude that student weight data is normally distributed.
In addition to statistical test, you cal also use histogram to visually assess whether the data appears to follow a normal distribution.
Create a histogram,
hist(data, main = "Student Weight Distribution", xlab = "Weight (kg)",
     ylab = "Frequency", col = "lightblue", border = "black")
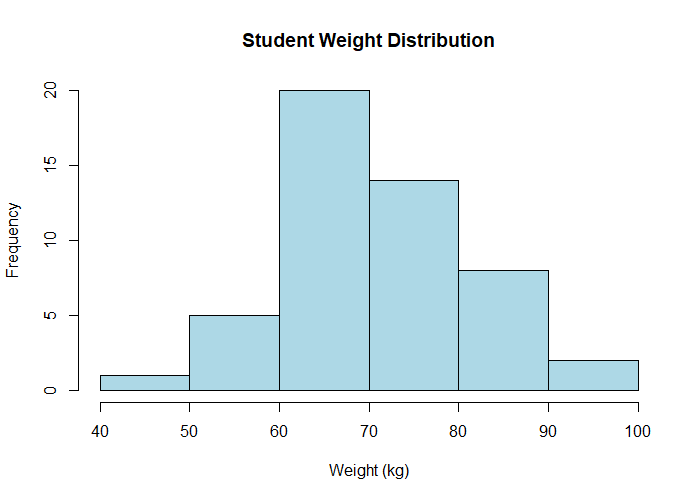
The shape of the histogram matches the bell shaped curve and suggests that the data is normally distributed.
In addition to histogram, the quantile-quantile (Q-Q) plot could also be used for more rigorous assessment of normality
# load package
library(EnvStats)

# Q-Q plot
qqPlot(data, add.line = TRUE)
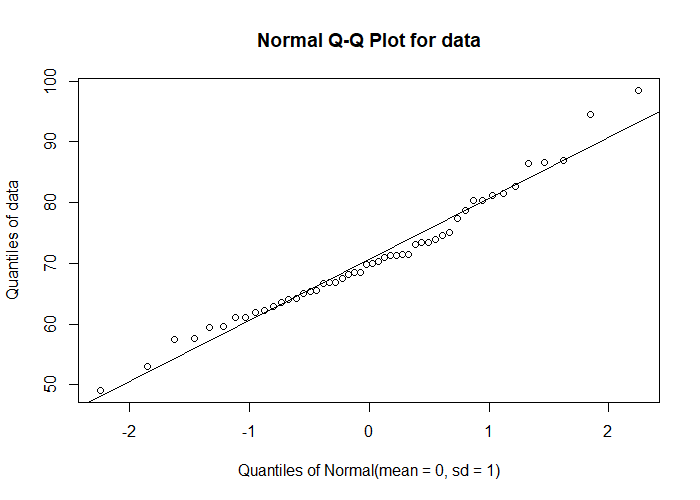
The data closely follows the reference line on Q-Q plot and suggests that data follows approximate normal distribution.
Enhance your skills with courses on Statistics and R
- Introduction to Statistics
- R Programming
- Data Science: Foundations using R Specialization
- Data Analysis with R Specialization
- Getting Started with Rstudio
- Applied Data Science with R Specialization
- Statistical Analysis with R for Public Health Specialization
This work is licensed under a Creative Commons Attribution 4.0 International License
Some of the links on this page may be affiliate links, which means we may get an affiliate commission on a valid purchase. The retailer will pay the commission at no additional cost to you.

