How to Use runif in R (Practical Examples)
runif() function from R generates random numbers from uniform distribution.
In uniform distribution, every value within the given range is equally likely to occur. Uniform distribution is mostly used in the generation of random numbers.
The general syntax of runif() looks like this:
runif(n, min = 0, max = 1)
Where,
| Parameter | Description |
|---|---|
n |
number of random numbers to generate |
min |
minimum value for the random numbers (default is 0) |
max |
maximum value for the random numbers (default is 1) |
The following examples demonstrate how to use the runif() (random uniform) function to generate random numbers.
Example 1: Generate random numbers between 0 and 1
By default, the runif() function generates random numbers between 0 to 1 from a uniform distribution.
The following example shows how to generate 10 random numbers between 0 and 1 using runif().
If you run the
runif()function multiple times, you may see different results every time. To get reproducible random results every time, you should useset.seed()function.
# for reproducible random result
set.seed(1)

# generate 10 random values between 0 to 1
runif(10)

# output
 [1] 0.62911404 0.06178627 0.20597457 0.17655675 0.68702285 0.38410372 0.76984142 0.49769924
 [9] 0.71761851 0.99190609
You can see that the 10 random values between 0 and 1 are generated from the uniform distribution.
Example 2: Generate random numbers between 1 and 100
The following example shows how to generate 10 random numbers between 1 and 100 from uniform distribution using
runif().
# for reproducible random result
set.seed(1)

# generate 10 random values between 1 to 100
runif(10, 1, 100)

# output
[1] 38.623483 77.967077 93.535818 22.002110 65.515703 13.429955 27.454846 39.225295
 [9]  2.325643 38.856408
You can see that the 10 random values between 1 and 100 are generated from the uniform distribution.
Example 3: Generate random integer numbers between 1 and 100
From the above examples, you have seen that runif() function generates floating numbers.
You can use either round (gives nearest integer) or floor (rounds down to nearest integer) to get the integer values
from a uniform distribution
# for reproducible random result
set.seed(1)

# generate 10 random integer values between 1 to 100 using round
round(runif(10, 1, 100))

# output
[1] 27 38 58 91 21 90 95 66 63  7

set.seed(1)
# generate 10 random integer values between 1 to 100 using floor
floor(runif(10, 1, 100))

# output
[1] 27 37 57 90 20 89 94 66 63  7
You can see that the 10 random integer values between 1 and 100 are generated from the uniform distribution.
Example 4: Generate histogram from uniform distribution
You can also runif() function to generate random numbers and plot a histogram of uniform distribution (rectangular
distribution).
The following example generates 1000 random numbers and plots a histogram,
# for reproducible random result
set.seed(1)

# generate 1000 random integer values between 1 to 10 using round
x <- runif(1000, 1, 10)

# Create a histogram to visualize uniform distribution
library(ggplot2)
ggplot() + aes(x)+ geom_histogram(color="darkblue", fill="lightblue") +
    xlab("Random values") +
    ylab("Frequency count") +
    ggtitle("Uniform Distribution")
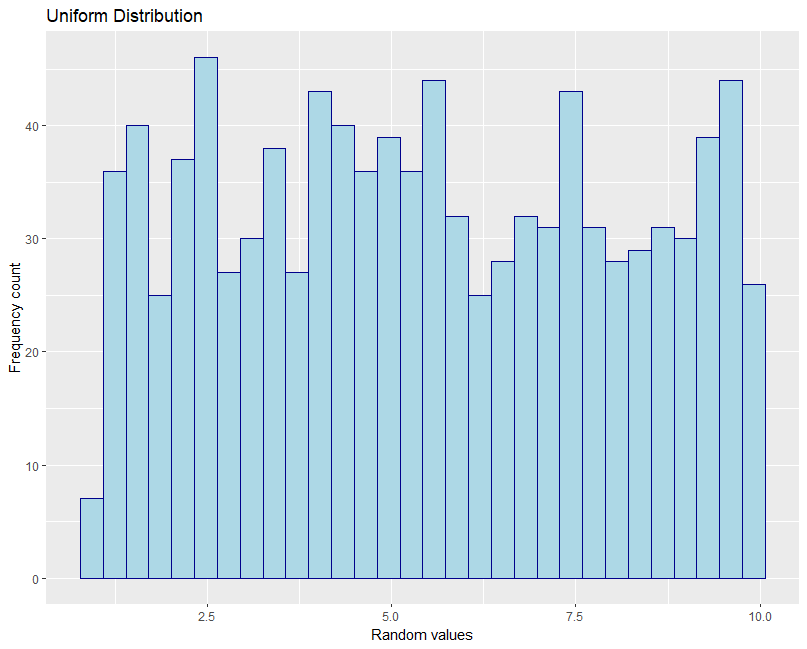
The above histogram visualizes the distribution of 1000 random numbers generated using the runif() function.
Related: random.uniform(): runif() Equivalent Function in Python
Enhance your skills with courses on Statistics and R
- Introduction to Statistics
- R Programming
- Data Science: Foundations using R Specialization
- Data Analysis with R Specialization
- Getting Started with Rstudio
- Applied Data Science with R Specialization
- Statistical Analysis with R for Public Health Specialization
This work is licensed under a Creative Commons Attribution 4.0 International License
Some of the links on this page may be affiliate links, which means we may get an affiliate commission on a valid purchase. The retailer will pay the commission at no additional cost to you.

