Fisher’s exact test of independence in Python [with example]
Fisher’s exact test
Fisher’s exact test is a statistical test used for testing the association between the two independent categorical variables. It is a non-parametric test and compares the proportion of categories in categorical variables.
In Fisher’s exact test, the null hypothesis of no association between the two categorical variables is tested against the alternate hypothesis that there is an association between the two categorical variables.
In contrast to the Chi-square test, which gives an approximate p value, Fisher’s exact test gives the exact p value. If you have a small sample size (say, < 1000), Fisher’s exact test is preferred over the Chi-square test. Fisher’s exact test is specifically used when the expected frequencies are less than 5 in more than 20% of cells in a contingency table.
Fisher’s exact test in Python
Fisher’s exact test example dataset
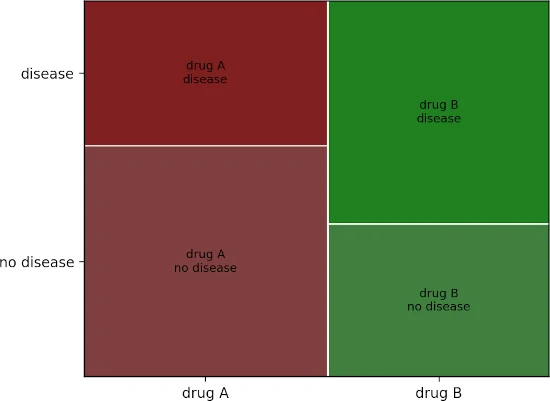
In the following table, there are two treatments (drug A and drug B) with their effect on disease development (disease and no disease). A large number of subjects receiving drug A developed no disease than drug B. Here, we need to test whether there is an association between drug treatments and disease status.
| drug A | drug B | |
|---|---|---|
| no disease | 80 | 48 |
| disease | 50 | 70 |
Learn more about Fisher’s exact test hypothesis and formula
Load and visualize the dataset
Create a DataFrame,
# create a pandas dataframe with row and column names
import pandas as pd
df = pd.DataFrame({'drug A':[80, 50], 'drug B':[48, 70]}, index=pd.Index(['no disease', 'disease']))
df
# output
            drug A  drug B
no disease      80      48
disease         50      70
Visualize the dataset as mosaic plot,
import matplotlib.pyplot as plt
from statsmodels.graphics.mosaicplot import mosaic

df_dict = {('drug A', 'no disease'): 80, ('drug A', 'disease'): 50, ('drug B', 'no disease'): 48,
           ('drug B', 'disease'): 70}
mosaic(df_dict)
plt.show()
Perform fisher’s exact test
Fisher’s exact test can be performed using the fisher_exact function available in the SciPy package,
fisher_exact function takes the following two arguments,
table: A 2x2 contingency table of non-negative integers
alternative: Type of test to calculate p value
(two-sided, less, or greater)
from scipy.stats import fisher_exact
oddsr, p = fisher_exact(table=df.to_numpy(), alternative='two-sided')
oddsr, p
# output
(2.3333333333333335, 0.001425903669576289)
The p value (two-tailed) obtained from Fisher’s exact test is significant [p = 0.00142, Odds ratio = 2.33] is statistically significant (p < 0.05) and therefore, we reject the null hypothesis. Thus, we can conclude that there is a significant association between drug treatment and disease status.
The odds ratio (OR) can be used as an effect size for understanding the drug treatment effect and decision-making. The odds ratio indicates that the odds of getting no disease while on drug treatment is 2.33 times that of getting the disease. In other words, the subject getting drug treatment is more likely to get no disease than the subject not getting treatment.
Check online calculator for Fisher’s exact test
Enhance your skills with courses on Machine Learning and Python
- Machine Learning with Python
- Machine Learning for Data Analysis
- Cluster Analysis in Data Mining
- Python for Everybody Specialization
Related reading
- Fisher’s exact test of independence in R
- Friedman test using R (with examples and code)
- What is p value and how to calculate p value by hand
References
- Wong KC. Chi squared test versus Fisher’s exact test. Hong Kong Med J. 2011 Oct;17(5):427.
- THE ANALYSIS OF CATEGORICAL DATA:FISHER’S EXACT TEST
If you have any questions, comments, corrections, or recommendations, please email me at reneshbe@gmail.com
This work is licensed under a Creative Commons Attribution 4.0 International License

