Heatmap in Python

What is heatmap?
- Continuous colormap where each color represents a specific set of values
- Great way to visualize and identify statistically significant gene expression changes among hundreds to thousands of genes from different treatment conditions
How to create a heatmap using Python?
- We will use
bioinfokit v0.6or later - Check bioinfokit documentation for installation and documentation
- For generating a heatmap plot, I have used gene expression data published in Bedre et al. 2015 to identify gene expression changes (induced or downregulated) in response to fungal stress in cotton. (Read paper). Here’s you can download gene expression dataset used for plotting heatmap: dataset
Note: If you have your own dataset, you should import it as pandas dataframe. Learn how to import data using pandas
If you want to create interactive heatmap, check this article
Now plot heatmap with hierarchical clustering using bioinfokit,
from bioinfokit import analys, visuz
# load dataset as pandas dataframe
df = analys.get_data('hmap').data
df.head(2)
    Gene         A         B         C        D        E         F
0  B-CHI  4.505700  3.260360 -1.249400  8.89807  8.05955 -0.842803
1   CTL2  3.508560  1.660790 -1.856680 -2.57336 -1.37370  1.196000

# set gene names as index
df = df.set_index(df.columns[0])
df.head(2)
              A         B         C        D        E         F
Gene
B-CHI  4.505700  3.260360 -1.249400  8.89807  8.05955 -0.842803
CTL2   3.508560  1.660790 -1.856680 -2.57336 -1.37370  1.196000


# heatmap with hierarchical clustering
visuz.gene_exp.hmap(df=df, dim=(3, 6), tickfont=(6, 4))

# heatmap without hierarchical clustering
visuz.gene_exp.hmap(df=df, rowclus=False, colclus=False, dim=(3, 6), tickfont=(6, 4))
# heatmaps will be saved in same directory
# set parameter show=True, if you want view the image instead of saving
Generated heatmaps with and without hierarchical clustering by above code,
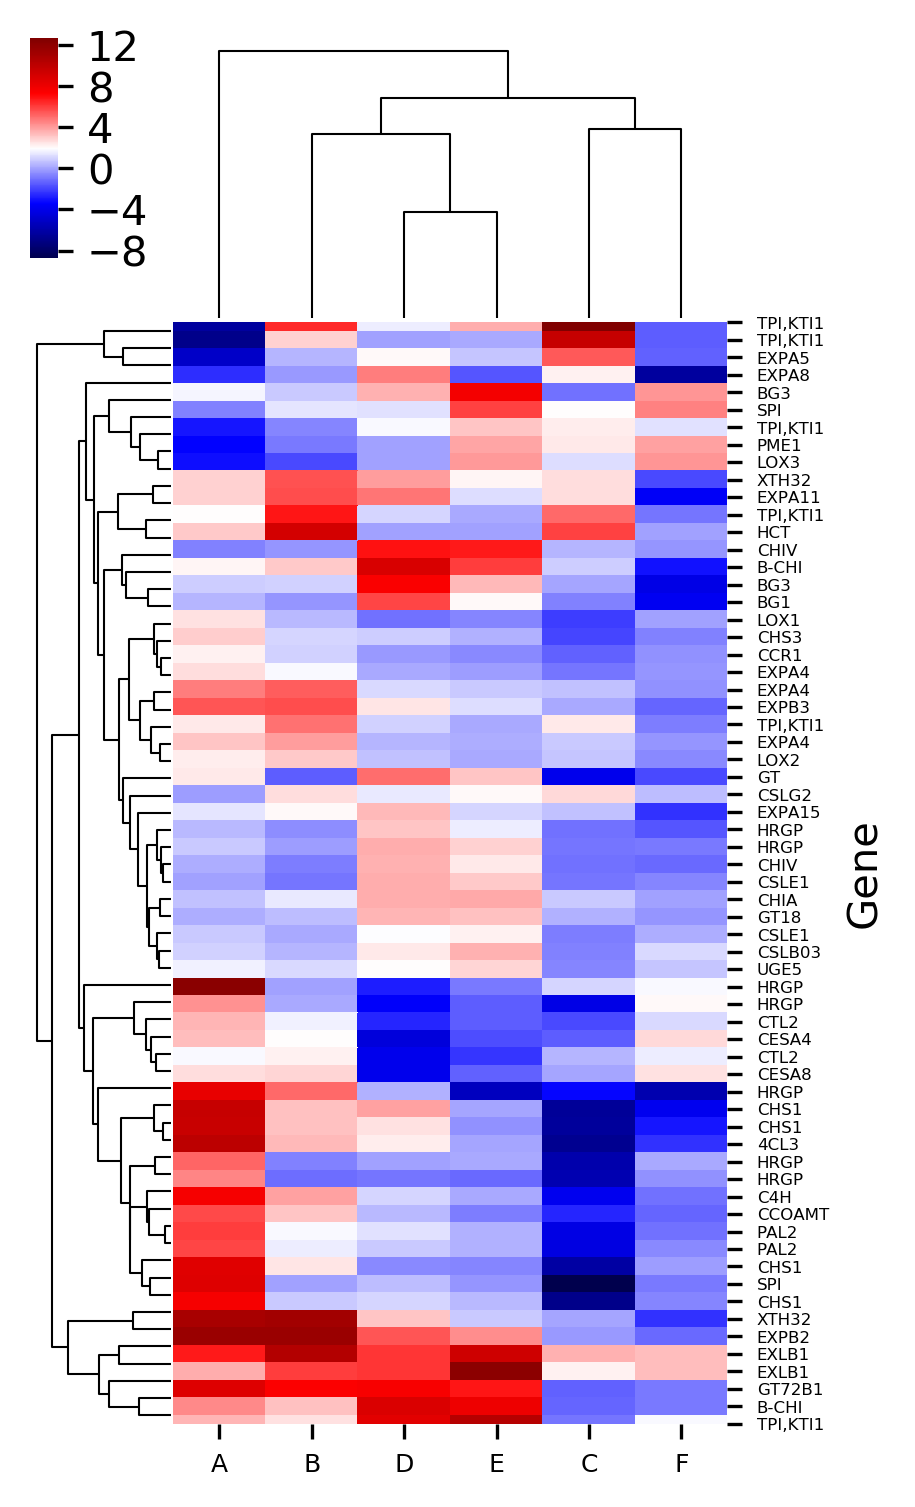
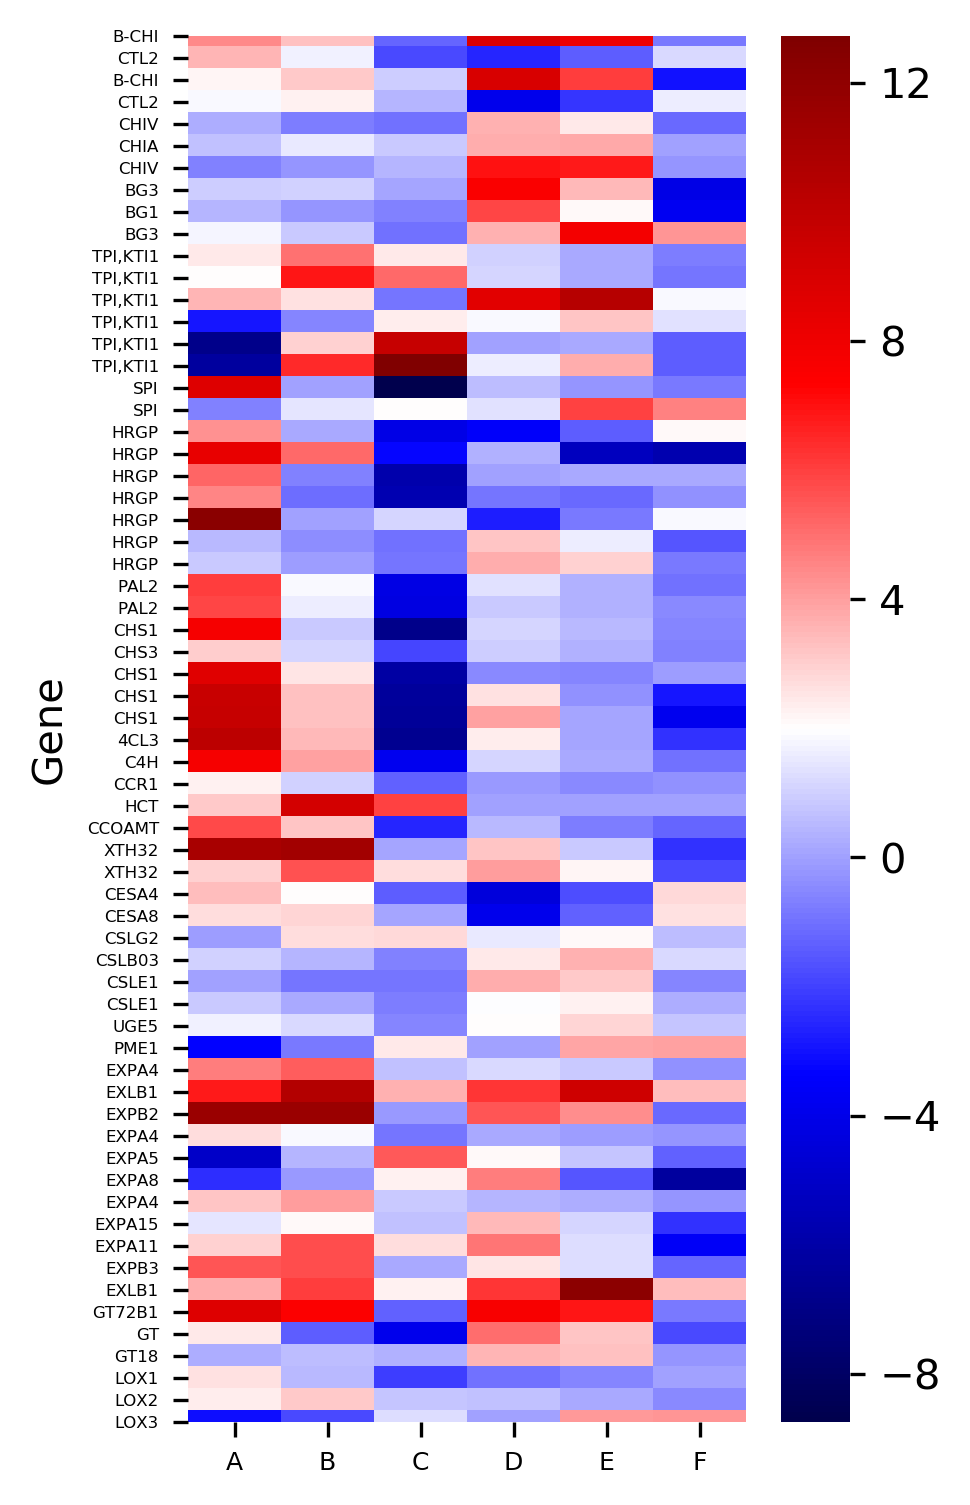
The X-axis represents the treatment conditions and Y-axis represents the gene names. I have changed the names of six treatment conditions to A to F for the simplicity of understanding. You can Read paper for a detailed understanding of the dataset.
Now plot heatmap with different colormaps,
# colormaps are available at  https://matplotlib.org/3.1.0/tutorials/colors/colormaps.html
# default is seismic
# here I use red-yellow-green: RdYlGn
visuz.gene_exp.hmap(df=df, cmap='RdYlGn', dim=(3, 6), tickfont=(6, 4))

# heatmap without hierarchical clustering
visuz.gene_exp.hmap(df=df, rowclus=False, colclus=False, cmap='RdYlGn', dim=(3, 6), tickfont=(6, 4))
Generated heatmaps with a red-yellow-green colormap,


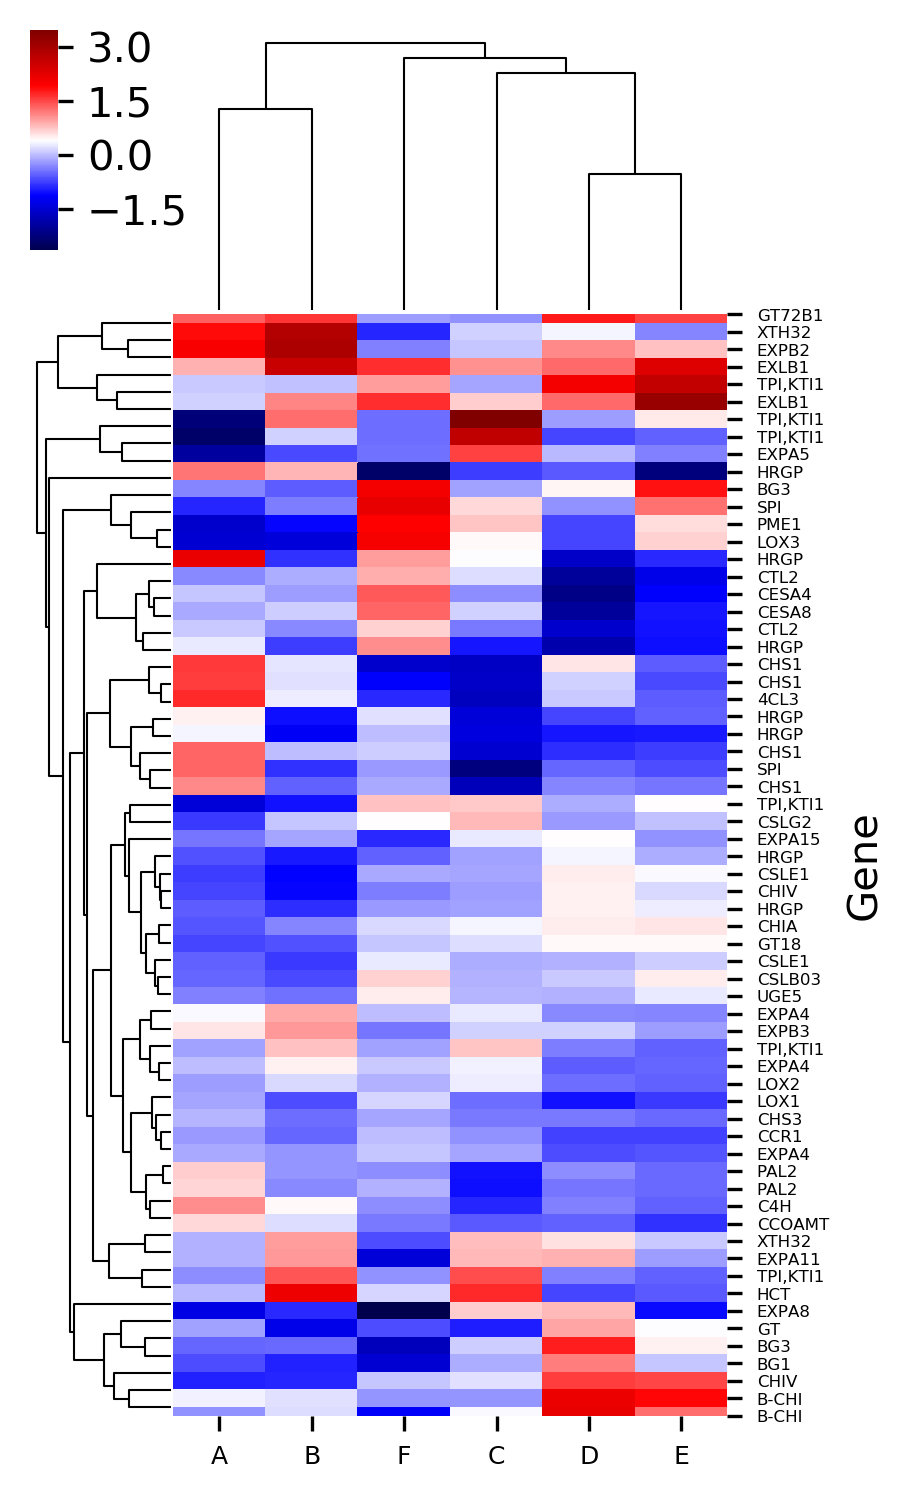
Now plot heatmap with standardized values,
# Z-score can be used to standardize value with mean 0 and var 1
# default Z-score is set to None and it applies to only heatmap with cluster
# here I standardize column with Z-score
visuz.gene_exp.hmap(df=df, zscore=1, dim=(3, 6), tickfont=(6, 4))
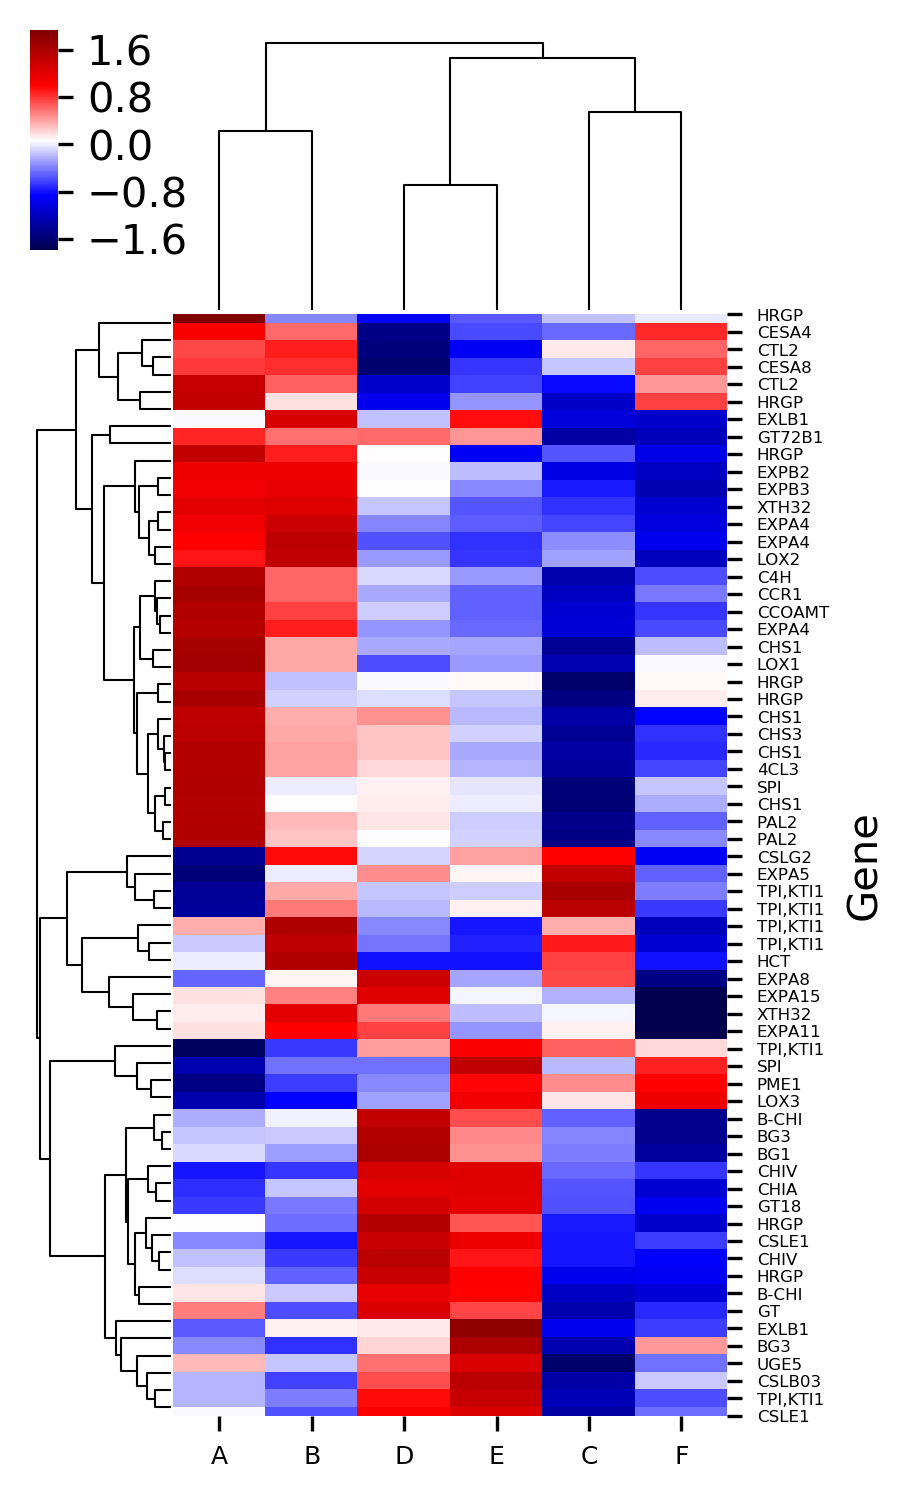
# here I standardize row with Z-score
visuz.gene_exp.hmap(df=df, zscore=0, dim=(3, 6), tickfont=(6, 4))
Generated heatmaps with Z standardized column and row,
This article describes how you can create basic clustered heatmaps. If you are looking for advanced heatmaps with annotation and clustering features, read my article on creating heatmaps with pheatmap
In addition to these features, we can also control the label fontsize, figure size, resolution, figure format, and scale of the heatmaps.
Check detailed usage
Enhance your skills with courses on genomics and bioinformatics
- Genomic Data Science Specialization
- Biology Meets Programming: Bioinformatics for Beginners
- Python for Genomic Data Science
- Bioinformatics Specialization
- Command Line Tools for Genomic Data Science
- Introduction to Genomic Technologies
Related reading
- Interactive Heatmap in Python (using hvPlot and Bokeh)
- What is p value and how to calculate p value by hand
References:
- Michael Waskom, Olga Botvinnik, Joel Ostblom, Saulius Lukauskas, Paul Hobson, MaozGelbart, … Constantine Evans. (2020, January 24). mwaskom/seaborn: v0.10.0 (January 2020) (Version v0.10.0). Zenodo. http://doi.org/10.5281/zenodo.3629446
- Bedre R, Rajasekaran K, Mangu VR, Timm LE, Bhatnagar D, Baisakh N. Genome-wide transcriptome analysis of cotton (Gossypium hirsutum L.) identifies candidate gene signatures in response to aflatoxin producing fungus Aspergillus flavus. PLoS One. 2015;10(9).
This work is licensed under a Creative Commons Attribution 4.0 International License
Some of the links on this page may be affiliate links, which means we may get an affiliate commission on a valid purchase. The retailer will pay the commission at no additional cost to you.

