Statistical hypothesis testing, types of errors, and interpretation of p values
What is hypothesis testing?
- Hypothesis testing or null hypothesis significance tests (NHST) is an important statistical tool for making uniform decisions about a population based on sample data drawn from that population. The statistical methods (e.g. t test, ANOVA, Z-test, etc.) are applied on sample data to test the population null hypothesis.
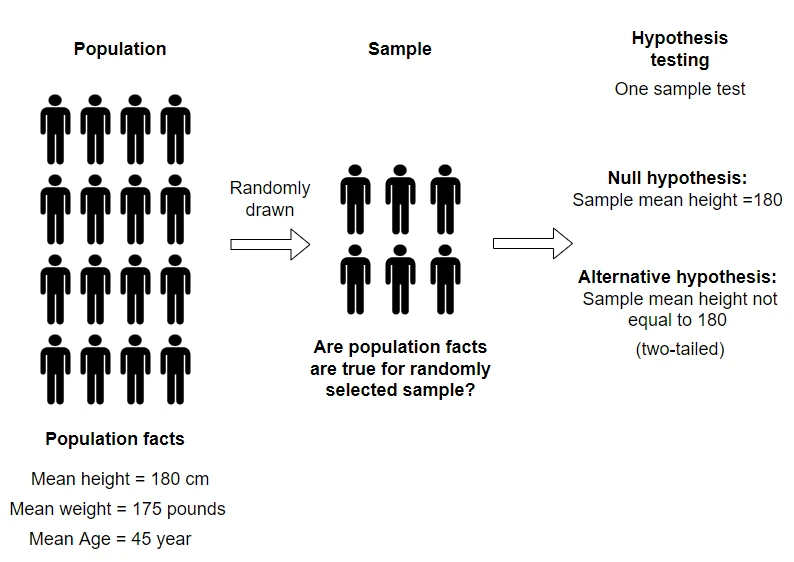
- Some examples of hypothesis testing includes comparing a sample mean with the population mean, gene expression between two conditions, the yield of two plant genotypes, an association between drug treatment and patient survival, the effect of multiple fertilizers on plant growth, etc.
Steps involved in hypothesis testing
- Propose null and Alternative hypotheses based on the research questions
- Specify the significance level (α) for rejecting or accepting (fail to reject) the null hypothesis
- Perform the experiment and collect the data
- Use appropriate statistical test to calculate the test statistics and p value
- Interpret the analysis output
Null and Alternative hypothesis
- Hypothesis testing is useful to answer the research questions and should be proposed before the experiment.
- For example, Are the changes in expression of some genes are induced by the treatment conditions? This research question can be stated simply in terms of the null hypothesis (H0) as “there is no difference in gene expression between control and diseased conditions” versus Alternative hypothesis (Ha) “there is a difference in gene expression between control and diseased conditions”.
- The appropriate statistical tests are then applied to test the null hypothesis against the Alternative hypothesis. For the above example, a two-sample t-test would be appropriate to test the gene expression differences between the two conditions.
- The statistical tests based on the collected data provide evidence based on the p value to reject or fail to reject the null hypothesis.
- If the p value is 0.01 (very unlikely event has occurred), it suggests that there is 1 chance out of 100 that you would obtain the difference in expression of the gene between two conditions when the null hypothesis is true. Generally, the null hypothesis is rejected at the 0.05 significance level (α).
One- and two-tailed (sided) Alternative hypothesis
- A One-tailed or one-sided hypothesis specifies the direction of the outcome (either greater or lesser).
For example,
one-tailed (greater) null hypothesis “H0: expression of a gene is higher in diseased condition than control condition”
one-tailed (lesser) null hypothesis “H0: expression of a gene is lesser in diseased condition than control condition” - One-tailed hypothesis are appropriate when only one direction of the outcome is more meaningful (e.g. drug has more side effects than control)
- A two-tailed or two-sided hypothesis would check if there is a difference (either greater or lesser) in the expression
of the gene between control and diseased conditions.
For example,
two-tailed (greater or lesser) null hypothesis “H0: there is a difference in the gene expression between control and diseased conditions”
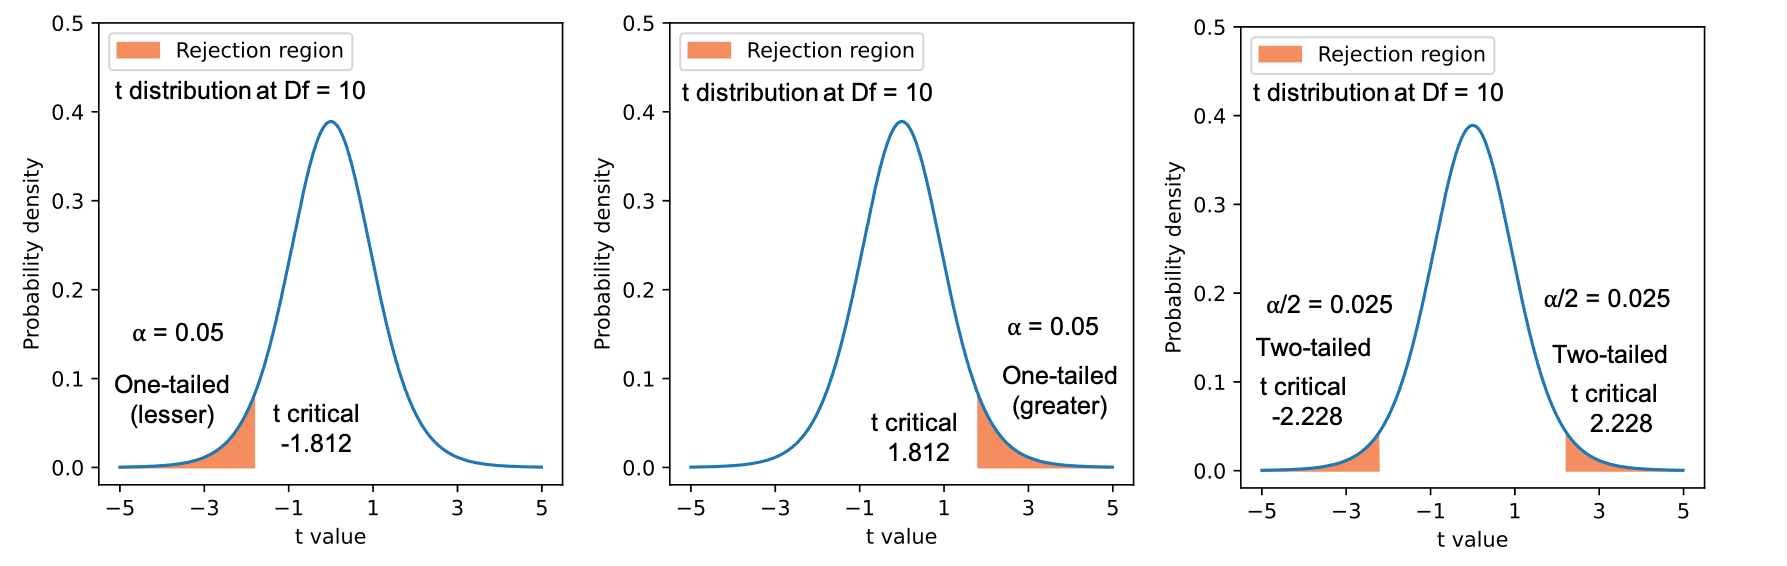
Figure 1: t probability distributions for one-tailed (lesser and greater) and two-tailed hypotheses with 10 degree of freedoms
Type I (α), type II errors (β), and power (1-β)
- Now, we have the null and Alternative hypotheses and collected the data for statistical analysis. For gene expression example, the two-sample t-test can be conducted to test the null hypothesis against the Alternative hypothesis.
- If the p value obtained from the t-test is less than the significance level (α) 0.05 (|t| > t critical), the null hypothesis is rejected and the difference is statistically significant.
- Here, α = 0.05 (5%) represents the maximum chance of rejecting the null hypothesis when it is actually true (fail to reject the null hypothesis). The significance level (α) is also known as type I error (false positive).
- Generally, the significance level (α) is set in advance. The 5% significance level is arbitrary and can be changed based on the study design and research questions.
-
If the p value is 0.01, it suggests that there is 1 chance out of 100 that you would obtain the difference in expression of a gene between two conditions when the null hypothesis is true.
null hypothesis (H0) difference
(H0 is false)no difference
(H0 is true)reject H0 true
(1-β)type I error (α)
(reject H0 when it is true)fail to reject H0 type II error (β) true
(1-α) - type II error (β) (false negative) occurs when the null hypothesis is fail to reject when it is actually reject.
- The quantity 1-β is defined as the power (probability of not doing type II error). In other words, power is the probability of rejecting the null hypothesis when there is a significant difference i.e. H0 is false.
- It is ideal to have high power. The power can be increased by a larger sample size, increasing the significance level (α), smaller variance, and using proper experimental design.
Learn how to calculate p value
Test statistics
- Test statistics (e.g. t test, z test, or F test) are useful for calculating p values and to make uniform decisions to reject or fail to reject the null hypothesis.
- Most of the time, it is difficult to have data from the whole population, test statistics are calculated based on the random samples from the population, which are assumed to have similar characteristics as population such as probability distribution.
- Large samples (n >= 30) drawn from a population (N) exhibit an approximate normal distribution for sample means, as per Central Limit Theorem (CLT). The z test statistic (z-score) follows a standard normal distribution (z distribution) can be used for large samples.
- For smaller sample size data, the t test statistic (Student’s t-test) can be used
Hypothesis testing examples
- Hypothesis testing using t-test
- Hypothesis testing using ANOVA
- Hypothesis testing using chi-squared test
References
- Banerjee A, Chitnis UB, Jadhav SL, Bhawalkar JS, Chaudhury S. Hypothesis testing, type I and type II errors. Industrial psychiatry journal. 2009 Jul;18(2):127. https://link.springer.com/article/10.1186/cc1493
- Pereira SM, Leslie G. Hypothesis testing. Australian Critical Care. 2009 Nov 1;22(4):187-91.
If you have any questions, comments or recommendations, please email me at reneshbe@gmail.com
This work is licensed under a Creative Commons Attribution 4.0 International License

