K-means Clustering in Python: Detailed Guide With Example
What is K-means clustering?
K-means clustering is an unsupervised clustering method where all data points are iteratively partition into k number of clusters, each of which is represented by its centroids.
The centroid of a cluster is often a mean of all data points in that cluster. The data points in a cluster are closest to the centroids of that cluster.
There is a high similarity between data points in a cluster and data points from one cluster is dissimilar to the data points of another cluster.
K-means clustering distance calculation
K-means clustering assigns each data point to centroid based on the minimum distance and hence distance calculation is very important in K-means clustering.
The K-means Euclidean distance measures to calculate distances between the data points and centroids.
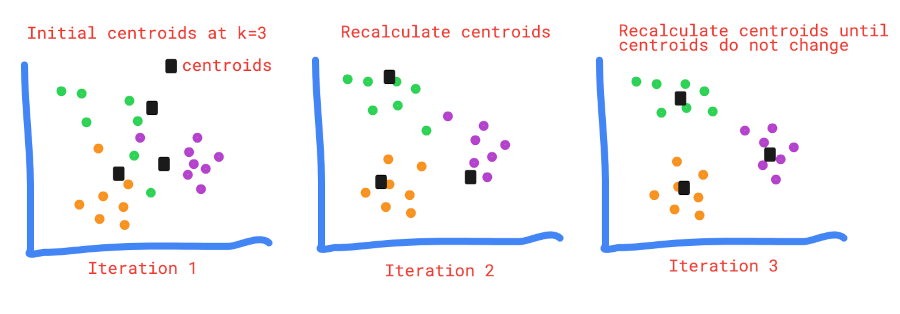
How K-means clustering work?
There are four major steps involved in K-means clustering,
- Choose the k number of clusters and determine their centroids
- Assign each data point to its nearest centroid using distance measures (e.g. Euclidean distance)
- Recalculate the new centroids and again assign each data point to its nearest centroid
- Repeat step 3 and 4 until centroids do not change or no change in criterion function (J)
K-means cost function
Suppose we have (x1, x2, …, xn) samples in m dimensions, then K-means clustering divides the n samples into K clusters such that the cost (total within-cluster sum of squares) is minimized,
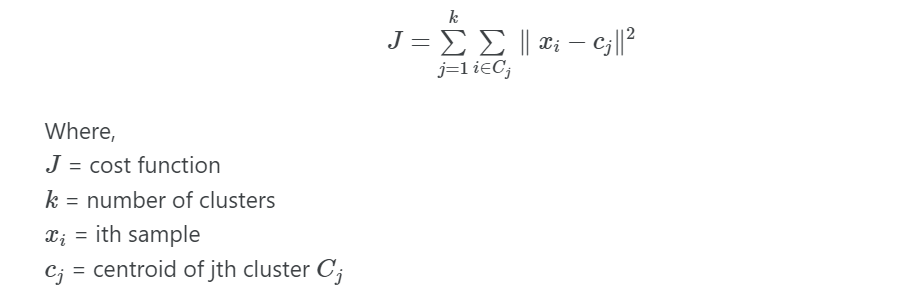
K-means clustering finds the optimal number of clusters (K) while minimizing the cost function (J). Each K cluster contains at least one data point.
Perform K-means clustering in Python
For this example, you will require sklearn, pandas, yellowbrick, seaborn and matplotlib Python packages. Check
for how to install Python packages
Get dataset
We will generate a random dataset with two features (columns) and four centers (number of class labels or clusters) using
the make_blobs function available
in the sklearn package.
We will pass the following parameters to make_blobs function,
- n_samples: number of samples or observations (rows)
- n_features: number of features or variables (columns)
- centers: number of clusters to create
- cluster_std: the standard deviation of the clusters. The lower the standard deviation, the closer will be data points in a given cluster
- random_state: Set this to any int (generally 0 or 42) to get the same output when you run it multiple times.
When there is a randomization process involved, you should use
random_stateto create reproducible output. If you don’t use this parameter, you may get different output than presented in this article.
from sklearn.datasets import make_blobs
import pandas as pd

dataset, classes = make_blobs(n_samples=200, n_features=2, centers=4, cluster_std=0.5, random_state=0)
# make as panda dataframe for easy understanding
df = pd.DataFrame(dataset, columns=['var1', 'var2'])
df.head(2)
       var1      var2
0  2.204387  1.560857
1 -1.133740  2.684673
Compute K-means clustering
Now, use this randomly generated dataset for k-means clustering using KMeans class and fit function
available in Python sklearn package.
When using K-means, it is crucial to provide the cluster numbers. In the dataset, we know that there are four clusters.
However, for finding the optimal number of clusters in the dataset, we need to use methods such as Elbow or Silhouette methods when we don’t know how many clusters to use.
Here, I will use the Elbow method to find the optimal number of clusters.
from yellowbrick.cluster import KElbowVisualizer
model = KMeans()
visualizer = KElbowVisualizer(model, k=(1,12)).fit(df)
visualizer.show()
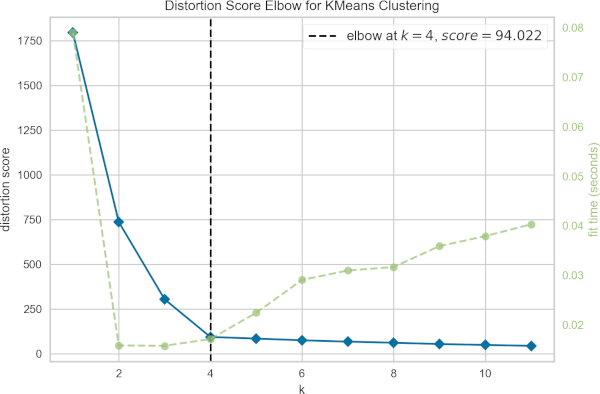
In the above figure, the optimal number of clusters (K) is plotted against the distortion (total of within-cluster sum of squares for a given number of K).
The optimal number of K is a point where there is a bend in the curve (elbow or knee). Based on the elbow method, the optimal number of clusters (K) is 4
If the data is not well clustered, the elbow method may not work.
In KMeans, n_clusters is the most important parameter and defines the number of clusters to form (default=8).
For this example, set this value to 4 for computing the K-means clustering,
Another important parameter is init, which defines the method initialization to use (default=’k-means++’). k-means++ algorithm uses the seeding technique for centroid initialization which is better than the random initialization method.
from sklearn.cluster import KMeans
kmeans = KMeans(n_clusters=4, init='k-means++', random_state=0).fit(df)
Once the K-means clustering is completed successfully, the KMeans class will have the following important attributes to
get the return values,
labels_: gives predicted class labels (cluster) for each data pointcluster_centers_: Location of the centroids on each cluster. The data point in a cluster will be close to the centroid of that cluster. As we have two features and four clusters, we should get four locations.inertia_: gives within-cluster sum of squares. This is a total of the within-cluster sum of squares for all clusters.n_iter_: number of iterations that K-means algorithm runs to get a minimum within-cluster sum of squares
kmeans.labels_  # same as kmeans.predict(df)
array([2, 0, 3, 1, 2, 3, 0, 3, 3, 3, 3, 2, 0, 0, 2, 3, 1, 1, 1, 2, 1, 0,
       2, 0, 2, 2, 1, 2, 2, 3, 1, 3, 0, 2, 0, 3, 0, 3, 3, 1, 1, 1, 1, 3,
       2, 0, 3, 1, 1, 3, 1, 0, 0, 1, 3, 1, 0, 2, 3, 2, 1, 3, 2, 3, 1, 3,
       2, 1, 0, 0, 2, 2, 3, 3, 0, 1, 0, 0, 2, 2, 1, 3, 2, 0, 0, 3, 3, 2,
       0, 0, 1, 1, 1, 3, 3, 2, 0, 1, 3, 3, 1, 2, 2, 1, 1, 0, 3, 2, 2, 3,
       1, 0, 0, 2, 2, 3, 0, 0, 1, 3, 1, 0, 3, 2, 3, 0, 3, 0, 2, 3, 0, 2,
       0, 1, 1, 0, 1, 1, 2, 1, 2, 0, 2, 2, 0, 2, 3, 2, 0, 1, 1, 1, 3, 0,
       2, 3, 1, 0, 1, 2, 1, 2, 2, 0, 0, 1, 3, 2, 2, 0, 2, 3, 0, 1, 1, 1,
       3, 3, 0, 3, 0, 2, 3, 2, 3, 0, 0, 1, 3, 1, 2, 2, 3, 1, 0, 0, 0, 3,
       1, 2], dtype=int32)

kmeans.inertia_
94.02242630751765

kmeans.n_iter_
2

kmeans.cluster_centers_
array([[-1.60782913,  2.9162828 ],
       [-1.33173192,  7.7400479 ],
       [ 2.06911036,  0.96146833],
       [ 0.91932803,  4.34824615]])
Get each cluster size,
from collections import Counter
Counter(kmeans.labels_)
# output
Counter({2: 50, 0: 50, 3: 50, 1: 50})
K-means clustering has four clusters of size 50, 50, 50 and 50.
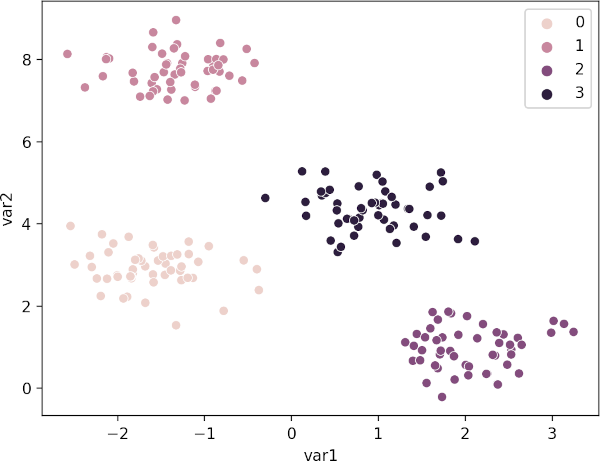
Visualization of K-means clustering
Visualize the cluster as scatter plot and color the clusters using predicted class labels,
import seaborn as sns
import matplotlib.pyplot as plt
sns.scatterplot(data=df, x="var1", y="var2", hue=kmeans.labels_)
plt.show()
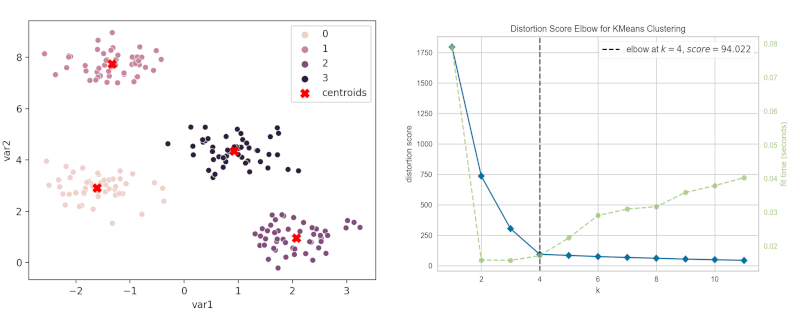
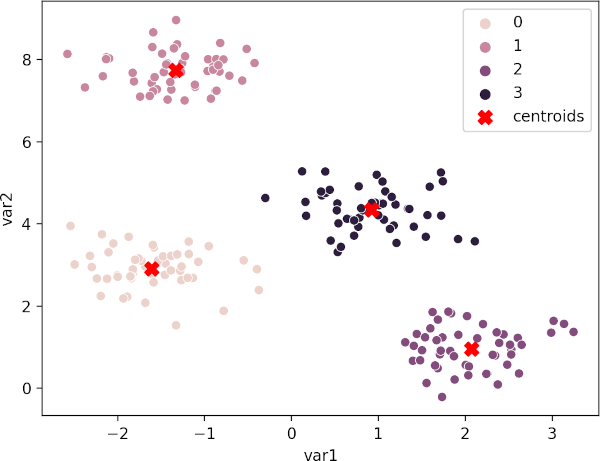
Plot K-means clustering plot with centroids,
sns.scatterplot(data=df, x="var1", y="var2", hue=kmeans.labels_)
plt.scatter(kmeans.cluster_centers_[:,0], kmeans.cluster_centers_[:,1],
            marker="X", c="r", s=80, label="centroids")
plt.legend()
plt.show()
Accuracy of K-means clustering
As k-means is a clustering method (not classification), the accuracy should not be evaluated. This is because we do not train the model with class label data and therefore there will be inconsistency in between true class labels and predicted class labels.
You may compare the scatterplot of original dataset and scatterplot after K-means clustering for evaluating the performance of K-means clustering.
K-means clustering limitation
- In K-means clustering, it is essential to provide the number of clusters to form from the data. If the dataset is well-separated, it would be easy to identify the optimal number of clusters using the elbow method. But, if the data is not well-separated, it would be difficult to find the optimal number of clusters.
- K-means clustering is not applicable to the categorical data as it’s prototype is based on the centroid. If you have categorical data, it is better to use K-medoids (Partition Around Medoids - PAM) clustering method. In K-medoids, the prototype is medoid (most representative data point for a cluster).
- K-means clustering is sensitive to outliers. DBSCAN clustering is an alternative method for clustering datasets with noise/outliers.
- K-means clustering works well with spherical-shaped clusters of similar sizes. If there are arbitrary-shaped clusters, K-means may not work well. You should consider DBSCAN clustering for arbitrary-shaped clusters.
- The K-means can produce empty clusters (no points assigned to the cluster) depending on the initialization method and the value of K. In this case, you should try clustering with different values of K.
Enhance your skills with courses on Machine Learning and Python
- Machine Learning Specialization
- Foundations of Data Science: K-Means Clustering in Python
- Machine Learning with Python
- Machine Learning for Data Analysis
- Cluster Analysis in Data Mining
- Python for Everybody Specialization
- Python for Genomic Data Science
Related reading
- Performing and visualizing the Principal component analysis (PCA) from PCA function and scratch in Python
- Support Vector Machine (SVM) basics and implementation in Python
- Logistic regression in Python (feature selection, model fitting, and prediction)
- DBSCAN in Python (with example dataset)
- Command Line Tools for Genomic Data Science
Reference
- Altman N, Krzywinski M. Points of significance: clustering. Nature methods. 2017 Jun 1;14(6):545-7.
- Govender P, Sivakumar V. Application of k-means and hierarchical clustering techniques for analysis of air pollution: A review (1980–2019). Atmospheric Pollution Research. 2020 Jan 1;11(1):40-56.
- Barbakh WA, Wu Y, Fyfe C. Non-standard parameter adaptation for exploratory data analysis. Berlin, Germany: Springer; 2009 Sep 24.
- Cluster Analysis: Basic Concepts and Algorithms
- Khan SS, Ahmad A. Cluster center initialization algorithm for K-means clustering. Pattern recognition letters. 2004 Aug 1;25(11):1293-302.
- Pakhira MK. A modified k-means algorithm to avoid empty clusters. International Journal of Recent Trends in Engineering. 2009 May 1;1(1):220.
If you have any questions, comments, corrections, or recommendations, please email me at reneshbe@gmail.com
This work is licensed under a Creative Commons Attribution 4.0 International License
Some of the links on this page may be affiliate links, which means we may get an affiliate commission on a valid purchase. The retailer will pay the commission at no additional cost to you.

