One and Two-sample Z-Test for proportions (with R code)
1. One-sample Z-Test for proportion
- One-sample Z-Test for proportion compares the observed sample proportion to the theoretical or known proportion of the population.
- For example, the researcher wants to test if the plant’s resistance to bacterial disease is controlled by the dominant gene. Among the 200 plants crossed in the F1 generation, the researcher obtained 154 resistant plants in the F2 generation. The proportion of resistant plants should be 75% in F2 generation. Does this sample plant data confirm that the proportion of resistant plants (dominant trait) in F2 generation is equal to 75%?
1.1 Hypotheses
One-sample Z-Test for proportion analyzes the following hypotheses,
- Null hypothesis (H0)
- p1 = p0 i.e. sample proportion is equal to the theoretical
or known proportion of the population
- p1 = p0 i.e. sample proportion is equal to the theoretical
- Alternative hypothesis (Ha)
- p1 ≠ p0 i.e. sample proportion is not equal to the theoretical or known proportion of the population (two-tailed test)
- p1 > p0 i.e. sample proportion is greater than the theoretical or known proportion of the population (one-tailed test)
- p1 < p0 i.e. sample proportion is lesser than the theoretical or known proportion of the population (one-tailed test)
Learn more about hypothesis testing and interpretation
1.2 Formula
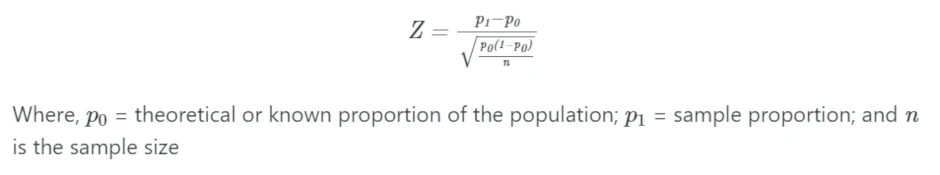
One-sample Z-Test for proportion is given as,
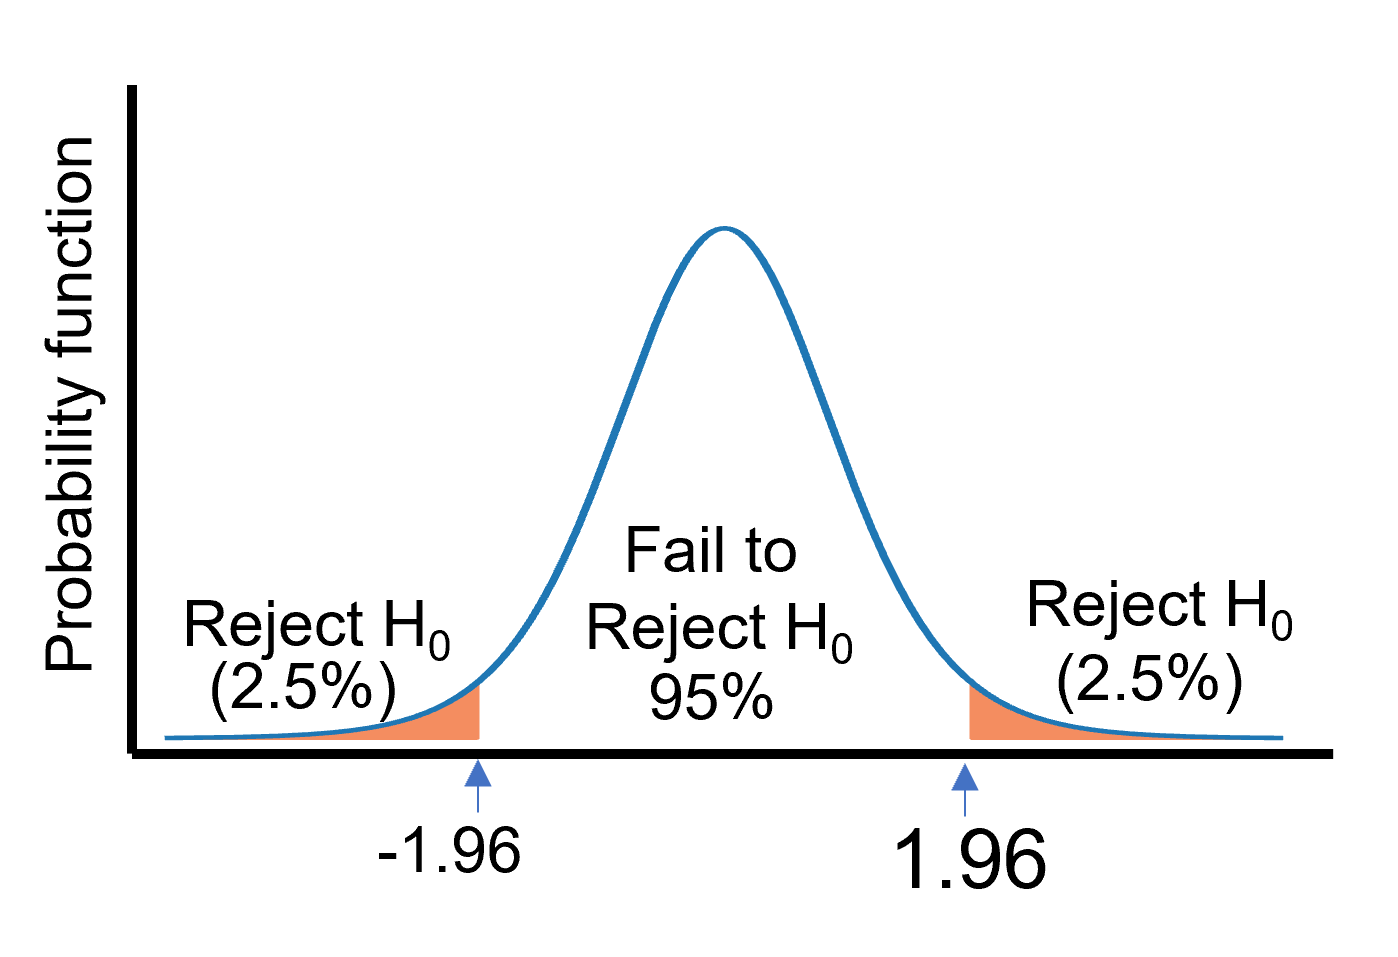
The Z-Test follows a normal distribution. Z-Test statistics is compared with the critical value at 5% significance to determine the p-value. Unlike the t-test, the Z-Test has a single critical value.
At 5% significance, the critical value is 1.96. If |Z| ≥ 1.96, reject the null hypothesis (the difference is significant). If |Z| < 1.96, fail to reject the null hypothesis (the difference is not significant).
2. Perform One-sample Z-Test for proportion in R
The binom.test() (when n ≤ 30) or prop.test() (when n >30) are commonly used for performing the One-sample Z-Test
for proportion
2.1 Example dataset
Suppose, the researcher wants to confirms that the proportion of resistant plants (dominant trait) is equal to 75%
From above example,
p0 = theoretical or known proportion of the population = 0.75
p1 = sample proportion = 154/200 = 0.77
n = sample size = 200
2.2 Calculate One-sample Z-Test for proportion in R (prop.test() )
As the sample size (n) is greater than 30, I will use prop.test() to calculate the One-sample Z-Test for proportion.
prop.test() compares the sample proportion to the theoretical proportion by calculating the χ2 statistics with
Yates’ correction for continuity
We will pass the following parameters to prop.test() function,
- x: Number of successes (number of successes or events occured from the sample)
- n: Number of trials (sample size)
- p: The vector of probabilities of success (theoretical or known proportion of the population)
- alternative: the tail of test (default “two.sided”). Use “greater” or “less” for a one-sided test
- correct: Apply Yates’ correction for continuity (default TRUE). Yates’ correction is conservative on smaller samples and gives roughly similar results for larger samples
Based on example, x = 154; n = 200; and p = 0.75
library(stats)
prop.test(x = 154, n = 200, p = 0.75)

# output
	1-sample proportions test with continuity correction

data:  154 out of 200, null probability 0.75
X-squared = 0.32667, df = 1, p-value = 0.5676
alternative hypothesis: true p is not equal to 0.75
95 percent confidence interval:
 0.7042503 0.8251428
sample estimates:
   p
0.77
As the p value obtained from the equal proportion test is not significant (χ2 = 0.3266, p = 0.5676), we fail to reject the null hypothesis.
In addition, the population proportion (0.75) also falls within the confidence interval [0.70 - 0.82] and supports non-significant p value.
Hence, we conclude that the sample proportion (proportion of resistant plants in the F2 generation) is equal to the known population proportion (75%).
3. Two-sample Z-Test for proportions
- Two-sample Z-Test for proportions compares the proportions of two samples, determining whether they are equal or significantly different from each other.
- For example, the researcher wants to test if the plant’s resistance to bacterial disease is controlled by the dominant gene. The researcher takes a sample of 200 plants from two different locations (A and B). Among the 200 plants crossed in the F1 generation in locations A and B, the researcher obtained 148 and 160 resistant plants in F2 generation from locations A and B, respectively. Is there an equal proportion of resistant plants in two locations?
3.1 Hypotheses
Two-sample Z-Test for proportions analyzes the following hypotheses,
- Null hypothesis (H0)
- p1 = p2 i.e. Two sample proportions are equal
- p1 = p2 i.e. Two sample proportions are equal
- Alternative hypothesis (Ha)
- p1 ≠ p2 i.e. Two sample proportions are not equal (two-tailed test)
- p1 > p2 i.e. sample proportion of resistant plants in A location is greater than sample proportion of resistant plants in B location (one-tailed test)
- p1 < p2 i.e. sample proportion of resistant plants in A location is lesser than sample proportion of resistant plants in B location (one-tailed test)
3.2 Formula
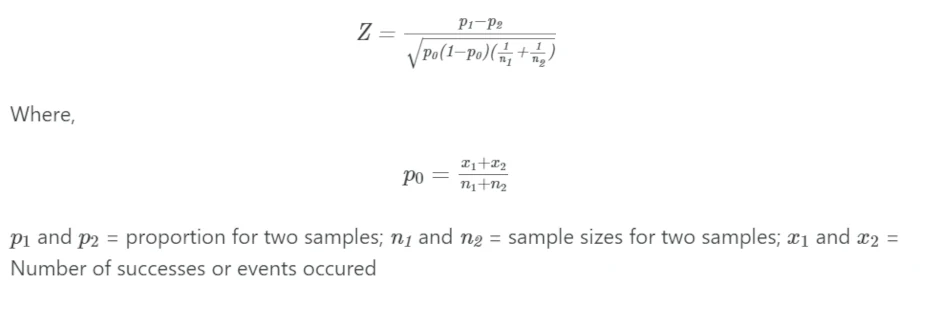
Two-sample Z-Test for proportions is given as,
The Z-Test follows a normal distribution. Z-Test statistics is compared with the critical value at 5% significance to determine the p-value. Unlike the t-test, the Z-Test has a single critical value.
At 5% significance, the critical value is 1.96. If |Z| ≥ 1.96, reject the null hypothesis (the difference is significant). If |Z| < 1.96, fail to reject the null hypothesis (the difference is not significant).
Two-sample Z-Test for proportions is equivalent to the Chi-square (χ2) test for independence. The χ2 statistics (uncorrected) is equal to the square of the Z statistics obtained from proportions of two independent samples
4. Perform Two-sample Z-Test for proportions in R
The binom.test() (when n ≤ 30) or prop.test() (when n >30) are commonly used for performing the Two-sample Z-Test
for proportions. prop.test() compares the two sample proportions by calculating the χ2 statistics with
Yates’ correction for continuity.
4.1 Example dataset
Suppose, the researcher want to compare the proportions of two samples from different locations for resistance trait,
From above example,
p1 = 148/200 = 0.74
p2 = 160/200 = 0.80
p0 = (148+160)/(200+200) = 0.77
n1 = n2 = 200
4.2 Calculate Two-sample Z-Test for proportions in R (prop.test() )
As the sample size (n) is greater than 30, I will use prop.test() to calculate the two sample proportion Z-Test.
prop.test() calculates the χ2 statistics with Yates’ correction for continuity
We will pass the following parameters to prop.test() function,
- x: Vector of number of successes (number of successes from sample)
- n: Vector of number of trials (sample size)
- alternative: tail of test (default “two.sided”). Use “greater” or “less” for one-sided test
- correct: Apply Yates’ correction for continuity (default TRUE). Yates’ correction is conservative on smaller samples and gives roughly similar results for larger samples
library(stats)
prop.test(x = c(148, 160), n = c(200, 200))

# output
prop.test(x = c(148, 160), n = c(200, 200))

	2-sample test for equality of proportions with continuity
	correction

data:  c(148, 160) out of c(200, 200)
X-squared = 1.7081, df = 1, p-value = 0.1912
alternative hypothesis: two.sided
95 percent confidence interval:
 -0.14727181  0.02727181
sample estimates:
prop 1 prop 2
  0.74   0.80
As the p value obtained from the Two-sample Z-Test for proportions is not significant (χ2 = 1.7081, p = 0.1912), we fail to reject the null hypothesis.
Hence, we conclude that the sample proportion of resistant plants in location A is equal to the sample proportion of resistant plants in location B i.e. Plants from two different locations exhibited similar distribution of plants with resistance traits in the F2 generation.
Enhance your skills with statistical courses using R
References
This work is licensed under a Creative Commons Attribution 4.0 International License
Some of the links on this page may be affiliate links, which means we may get an affiliate commission on a valid purchase. The retailer will pay the commission at no additional cost to you.

