How to perform Chi-squared (χ2) test for independence in Python (with example)
Chi-squared (χ2) test for independence
Chi-squared test for independence (also known as Pearson Chi-squared test) is a non-parametric method used for comparing the relationship between the two categorical (nominal) variables in a contingency table.
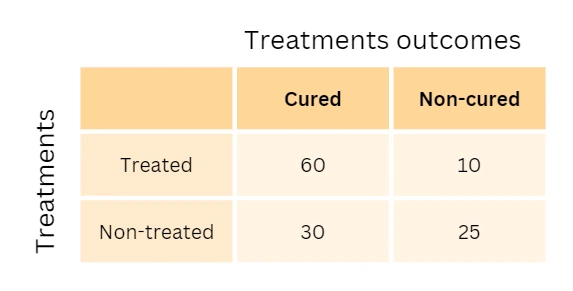
As an example, to determine whether treatments are related to treatment outcomes, one could use the chi-squared test for independence on two variables such as treatments (treated or nontreated) and outcome (cured or noncured). This example’s 2x2 contingency table would look like this,
Hypotheses for Chi-squared test for independence
Chi-squared test for independence analyzes the null hypothesis that there is no association between the two categorical variables versus the alternative hypothesis that there is an association between the two categorical variables
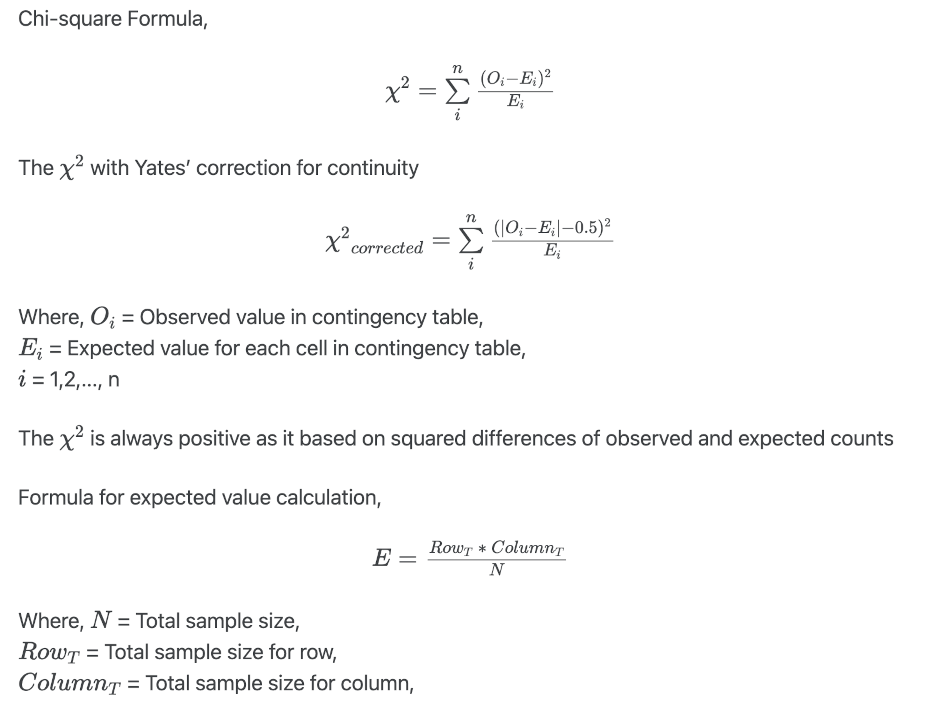
Chi-squared test statistics is given as,
You can read my article to understand how to perform and interpret hypothesis testing.
Chi-squared test is based on approximation (gives approximate p value) and hence require larger sample size. The expected frequency count should not be < 5 for more than 20% of cells. If the sample size is small, the chi-squared test is not accurate, and you should use Fisher’s exact test.
Chi-squared test assumptions
- The two variables are categorical (nominal) and data is randomly sampled
- The levels of variables are mutually exclusive
- The expected frequency count for at least 80% of the cell in a contingency table is at least 5. Fisher’s exact test is appropriate for small frequency counts.
- The expected frequency count should not be less than 1
- Observations should be independent of each other
- Observation data should be frequency counts and not percentages, proportions or transformed data
Calculate a chi-squared test for independence in Python
- We will use
bioinfokitv0.9.5 or later and scipy python packages - Check bioinfokit documentation for installation and documentation
- Download a hypothetical dataset for chi-square test for independence
Note: If you have your own dataset, you should import it as pandas dataframe. Learn how to import data using pandas
chi-square test for independence using bioinfokit,
from bioinfokit.analys import stat, get_data
# load example dataset
df = get_data('drugdata').data
df.head()
# output
   treatments  cured  noncured
0     treated     60        10
1  nontreated     30        25
# set treatments column as index
df = df.set_index('treatments')
# output
df.head()
            cured  noncured
treatments
treated        60        10
nontreated     30        25

# run chi-square test for independence
res = stat()
res.chisq(df=df)

# output
print(res.summary)
# corrected for the Yates’ continuity
Chi-squared test for independence

Test              Df    Chi-square      P-value
--------------  ----  ------------  -----------
Pearson            1       13.3365  0.000260291
Log-likelihood     1       13.4687  0.000242574

print(res.expected_df)

Expected frequency counts

      cured    noncured
--  -------  ----------
 0     50.4        19.6
 1     39.6        15.4
chi-square test for independence using chi2_contingency function from scipy package,
import numpy as np
from scipy.stats import chi2_contingency
# using Pearson’s chi-squared statistic
# corrected for the Yates’ continuity
observed = np.array([[60, 10], [30, 25]])
chi_val, p_val, dof, expected =  chi2_contingency(observed)
chi_val, p_val, dof, expected
# output
(13.3364898989899, 0.0002602911116400899, 1, array([[50.4, 19.6],
       [39.6, 15.4]]))

# without Yates’ correction for continuity
chi_val, p_val, dof, expected =  chi2_contingency(observed, correction=False)
chi_val, p_val, dof, expected
# output
(14.842300556586274, 0.00011688424010613195, 1, array([[50.4, 19.6],
       [39.6, 15.4]]))

# for log-likelihood method run command as below
chi_val, p_val, dof, expected =  chi2_contingency(observed, lambda_="log-likelihood")
Yates’ correction for continuity
- In the χ2 test, the discrete probabilities of observed counts can be approximated by the continuous chi-squared probability distribution. This can cause errors and needs to be corrected using continuity correction.
- Yates’ correction for continuity modifies the 2x2 contingency table and adjust the difference of observed and expected counts by subtracting the value of 0.5 (see formula).
- Yates’ correction for continuity increases the p value by reducing the χ2 value. The corrected p value is close to exact tests such as the Fisher exact test. Sometimes, Yates’ correction may give an overcorrected p value.
- χ2 and Yates’ corrected χ2 produce similar results on large samples, but Yates’ corrected χ2 can be conservative on smaller samples and gives a higher p value.
Interpretation
The p value obtained from chi-square test for independence is significant (p < 0.05), and therefore, we conclude that there is a significant association between treatments (treated and nontreated) with treatment outcome (cured and noncured)
Related reading
References
- Virtanen P, Gommers R, Oliphant TE, Haberland M, Reddy T, Cournapeau D, Burovski E, Peterson P, Weckesser W, Bright J, van der Walt SJ. SciPy 1.0: fundamental algorithms for scientific computing in Python. Nature methods. 2020 Mar;17(3):261-72.
- Bewick V, Cheek L, Ball J. Statistics review 8: Qualitative data–tests of association. Critical care. 2003 Feb 1;8(1):46.
- Serra N, Rea T, Di Carlo P, Sergi C. Continuity correction of Pearson’s chi-square test in 2x2 Contingency Tables: A mini-review on recent development. Epidemiology, Biostatistics and Public Health. 2019 Jun 21;16(2).
If you have any questions, comments or recommendations, please email me at reneshbe@gmail.com
This work is licensed under a Creative Commons Attribution 4.0 International License

