How to Perform Fisher’s Exact Test in R
What is Fisher’s exact test
Fisher’s exact test is a non-parametric method for comparing the proportion of categories in two different independent categorical variables in a contingency table.
Fisher’s exact test is generally used for datasets with small sample sizes (< 1000), especially when the frequency count is < 5 for more than 20% of cells . The chi-square test should be used for datasets with large sample sizes.
Fisher’s exact test often applied to 2x2 contingency tables, which represent the frequency distribution of two categorical variables. These variables typically have two levels each. For example, responses measured as male/female, treated/no treated, cured/no cured, etc.
Fisher’s exact test is an exact test which returns exact p value that represents the probability of obtaining the observed distribution assuming that the variables are independent.
Fisher’s exact test assumptions
- The two variables should be categorical
- Data should be randomly sampled
- The levels of variables are mutually exclusive
- Observations should be independent of each other
- Observation data should be frequency counts and not percentages, proportions or transformed data
- Fisher exact test is specifically designed for 2x2 contingency tables
Note: Fisher’s exact test is most commonly used to analyze a 2x2 contingency table, but it can also be used to analyze data from a larger contingency table. Fisher’s exact test is computationally intensive for larger contingency tables and may not be available in all statistical software.
Fisher’s exact test hypotheses
- Null hypothesis: The two categorical variables are independent (no association between the two variables)
- Alternative hypothesis: The two categorical variables are dependent (there is an association between the two variables)
Fisher’s exact test uses the hypergeometric distribution to assess the null hypothesis. Both one and two-tailed hypotheses can be tested using the Fisher’s exact test.
If the p value is less than or equal to the chosen significance level (typically 0.05), there is evidence to reject the null hypothesis, suggesting a significant association between the two variables.
Fisher’s exact test and odds ratio formula
Suppose, we have the following 2 ✕ 2 contingency table,
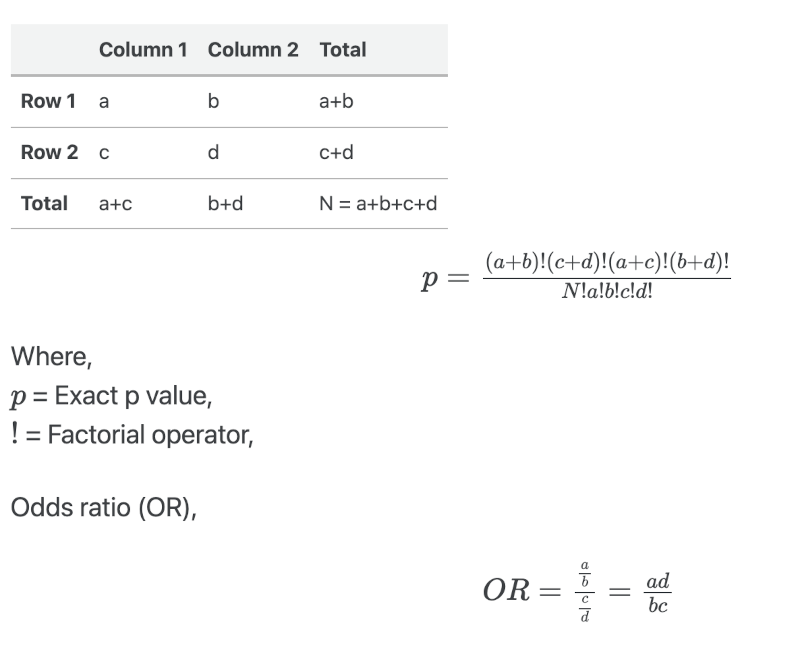
Fisher’s exact test for 2x2 contingency table in R
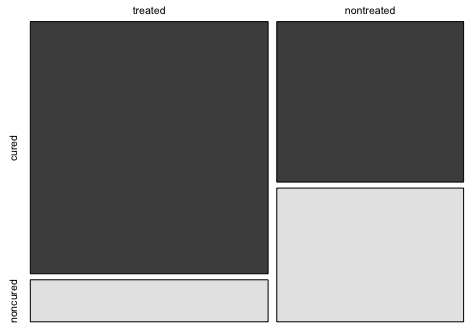
Suppose, there are two categorical variables with binary outcome viz. treatments (treated and nontreated) and treatment outcomes (cured and noncured). In this dataset, we need to test if there is an association between treatments and treatment outcomes.
Check how to perform Fisher’s exact test in Python
Load and visualize the dataset
Create a Data Frame,
# create a dataframe
df <- data.frame("cured" = c(60, 30), "noncured" = c(10, 25), row.names = c("treated", "nontreated"))
df
# output
           cured noncured
treated       60       10
nontreated    30       25
Visualize the dataset,
mosaicplot(df, color = TRUE)
Perform fisher’s exact test
library(stats)
fisher.test(df)
# output

	Fisher Exact Test for Count Data

data:  df
p-value = 0.0002357
alternative hypothesis: true odds ratio is not equal to 1
95 percent confidence interval:
  1.983312 13.107997
sample estimates:
odds ratio
  4.930093
Note: The odds ratio is calculated based on the conditional maximum likelihood estimation (MLE) rather than the sample odds ratio
Check online calculator for Fisher’s exact test
Interpretation
As the p value (two-tailed) obtained from Fisher’s exact test is significant [p = 0.00023, Odds ratio = 4.93, 95% CI = 1.98-13.10], we reject the null hypothesis (p < 0.05) and conclude that there is a strong association between the two categorical independent variables (treatment and treatment outcomes)
The odds ratio (OR) can be used as an effect size for understanding the treatment effect and decision-making. The odds ratio indicates that the odds of getting cured while on treatment is 4.93 times that of not getting cured. In other words, the person getting treatment is more likely get cured than the person not getting treatment.
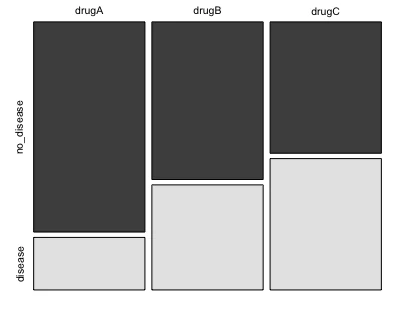
Fisher’s exact test for 3x2 contingency table
Suppose, there are three drug treatments (drug A, drug B, and drug C) with the outcome of a disease or no disease. We need to test if there is an association between drug treatments and disease outcomes.
| no disease | disease | |
|---|---|---|
| drug A | 40 | 10 |
| drug B | 10 | 40 |
| drug C | 25 | 25 |
Load and visualize the dataset
Create a Data Frame,
# create a dataframe
df <- data.frame("no_disease" = c(40, 30, 25), "disease" = c(10, 20, 25),
                    row.names = c("drugA", "drugB", "drugC"))
df
# output
      no_disease disease
drugA         40      10
drugB         30      20
drugC         25      25
Visualize the dataset,
mosaicplot(df, color = TRUE)
Perform Fisher’s exact test for 3x2 table
library(stats)
fisher.test(df)
# output
	Fishers Exact Test for Count Data

data:  df
p-value = 0.005304
alternative hypothesis: two.sided
Interpretation
As the p value (two-tailed) obtained from Fisher’s exact test is significant [p = 0.005304], we reject the null hypothesis (p < 0.05) and conclude that there is a strong association between the drug treatments and disease symptoms.
post-hoc test for Fisher’s exact test
After a significant association is identified in a higher contingency table, a post-hoc test for Fisher’s exact is performed to identify pairwise differences. Based on the example of 3x2 contingency table, we do not know which drug and disease outcomes have a significant association.
Here you can do pairwise Fisher’s exact test (using pairwise_fisher_test()) as post-hoc test to analyze each
combination. As there are multiple hypothesis testing, p values are
corrected using Benjamini-Hochberg FDR method for at a 5% cut-off.
library(rstatix)
pairwise_fisher_test(as.matrix(df), p.adjust.method = "fdr")

# output
  group1 group2     n       p   p.adj p.adj.signif
* <chr>  <chr>  <dbl>   <dbl>   <dbl> <chr>
1 drugA  drugB    100 0.0486  0.0729  ns
2 drugA  drugC    100 0.00305 0.00915 **
3 drugB  drugC    100 0.422   0.422   ns
The post-hoc test for Fisher’s exact test indicates that there is a significant association [adjusted p = 0.00915] of drug A and drug C with the disease outcome. In other words, the subject is more likely will not have a disease if they receive either of the drug (drug A or drug C).
Enhance your skills with statistical courses using R
- Statistics with R Specialization
- Data Science: Foundations using R Specialization
- Data Analysis with R Specialization
- Understanding Clinical Research: Behind the Statistics
- Introduction to Statistics
- R Programming
- Getting Started with Rstudio
References
- Wong KC. Chi squared test versus Fisher’s exact test. Hong Kong Med J. 2011 Oct;17(5):427.
- THE ANALYSIS OF CATEGORICAL DATA:FISHER’S EXACT TEST
If you have any questions, comments, corrections, or recommendations, please email me at reneshbe@gmail.com
This work is licensed under a Creative Commons Attribution 4.0 International License
Some of the links on this page may be affiliate links, which means we may get an affiliate commission on a valid purchase. The retailer will pay the commission at no additional cost to you.

