How to Perform Mann-Whitney U test in Python
Mann-Whitney U test
- Mann-Whitney U test is a non-parametric test which is alternative to the parametric two sample t-test.
It is first proposed by Frank Wilcoxon (1945) and later worked by Henry Mann and Donald Whitney (1947). Hence, the
Mann-Whitney U test is also known as Wilcoxon rank sum test or Wilcoxon‐Mann‐Whitney (WMW) test.
Wilcoxon rank sum test is different than Wilcoxon signed rank sum test. On paired data, the Wilcoxon signed rank sum test is used.
- Mann-Whitney U test used for comparing differences between two independent groups. It tests the hypothesis that if the two groups come from same population or have the same medians. It does not assume any specific distribution (such as normal distribution of samples) for calculating test statistics and p values. If there are more than two groups to analyze, you should consider Kruskal-Wallis test.
- The sample mean ranks or medians (not means) are compared in the Mann-Whitney U test based on the shape of distribution of two independent groups, which distinguishes it from the t-test, which compares sample means.
- Mann-Whitney U test can be applied on small (5-20) and large samples (n > 20). The power increases with sample size.
- Though Mann-Whitney U test and t-test has similar statistical power, it is always wise to use t-test if its assumptions are met.
Mann-Whitney U test assumptions
- The observations from the two groups should be randomly selected from the target populations
- Observations are independent of each other
- Observations should be continuous or ordinal (e.g. Likert item data)
Mann-Whitney U test Hypotheses
If we have two independent groups with observations x1, x2, …, xm and y1, y2, …, yn sampled from X and Y populations, then Mann-Whitney U test compares each observation xi from sample x with each observation (yj) from sample y.
Null hypothesis: p (xi > yj ) = 0.5
Alternative hypothesis: p (xi > yj ) ≠ 0.5
Above two-sided alternative hypothesis tests that there is equal probability of xi is greater or lesser than yj (both groups came from same population),
One-sided alternative hypothesis tests probability of xi is greater than yj and vice versa.
We can also state the two-sided hypothesis in terms of median as (when two groups have same shape of distribution)
Null hypothesis: Two groups have equal median
Alternative hypothesis: Two groups does not have equal median
One-sided alternative hypothesis tests median from one group can be greater or lesser than other group.
Learn more about hypothesis testing and interpretation
Mann-Whitney U Test formula
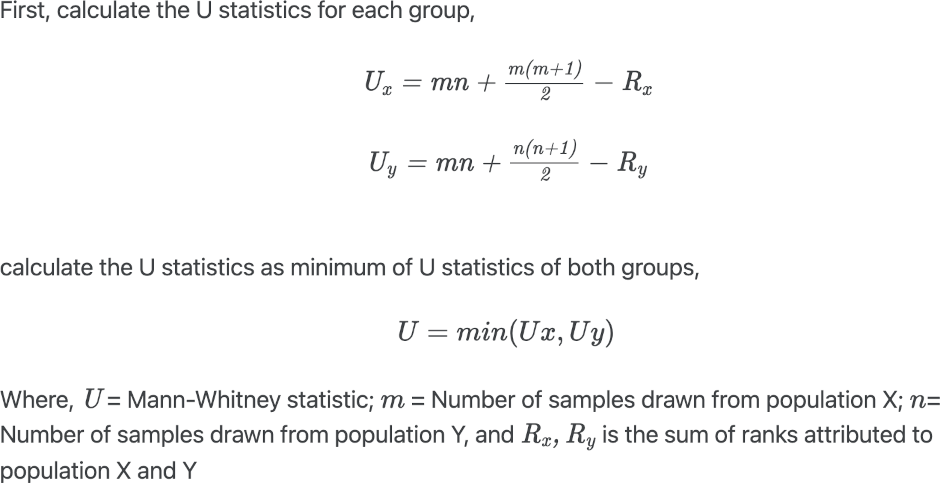
The p value is calculated based on the comparison between the critical value and the U value. If U value <= critical value, we reject the null hypothesis and vice versa. If the sample is large (n>20), the p value is calculated based on the normal approximation using standardized test statistics.
How Mann-Whitney U Test works?
- Merge the data from two samples and rank them from smallest to largest
- Calculate the sum of rank for each sample (Rx and Ry)
- Calculate Mann-Whitney test statistic (U) using the formula (minimum of Ux and Uy)
- Calculate p value by comparing U with the critical value
Perform Mann-Whitney U test in Python
Mann-Whitney U test example
Suppose, there are two plant genotypes (A and B) differing in their yield phenotype. Mann-Whitney U test is appropriate to compare the yield of two genotypes under the assumption that yield output does not follow the normal distribution.
Get example dataset and summary statistics
Load hypothetical plant genotypes (A and B) yield dataset,
Learn how to import data using pandas
import pandas as pd
df = pd.read_csv("https://reneshbedre.github.io/assets/posts/mann_whitney/genotype.csv")
df.head(2)
A B
0 60 10
1 30 25
# get summary statistics
df.agg(["count", "min", "max", "median", "mean", "skew"])
A B
count 23.000000 23.000000
min 20.000000 10.000000
max 60.000000 32.000000
median 56.000000 28.000000
mean 47.695652 25.217391
skew -0.710884 -1.270302
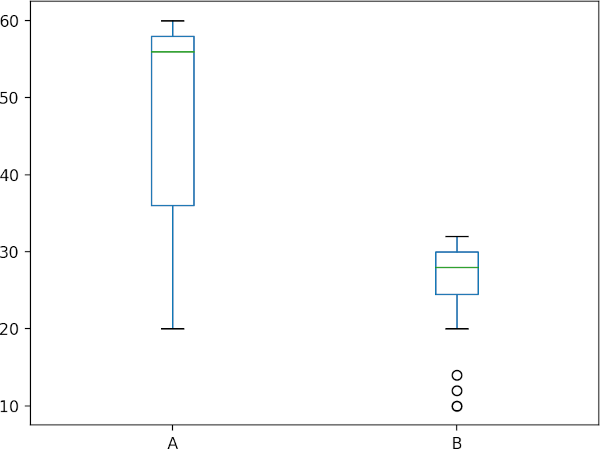
# generate boxplot to check data spread
import matplotlib.pyplot as plt
df.boxplot(column=['A', 'B'], grid=False)
plt.show()
Check data distribution
Check data distribution using Shapiro-Wilk test and histogram ,
import scipy.stats as stats
w, pvalue = stats.shapiro(df['A'])
w, pvalue
(0.8239281177520752, 0.0009495539125055075)

w, pvalue = stats.shapiro(df['B'])
w, pvalue
(0.7946348190307617, 0.00031481595942750573)

# plot histogram
import matplotlib.pyplot as plt
fig, (ax1, ax2) = plt.subplots(1, 2)
fig.suptitle('Frequency histogram of genotypes yield')
ax1.hist(df['A'], bins=10, histtype='bar', ec='k')
ax2.hist(df['B'], bins=10, histtype='bar', ec='k')
ax1.set_xlabel("Yield")
ax2.set_xlabel("Yield")
plt.show()
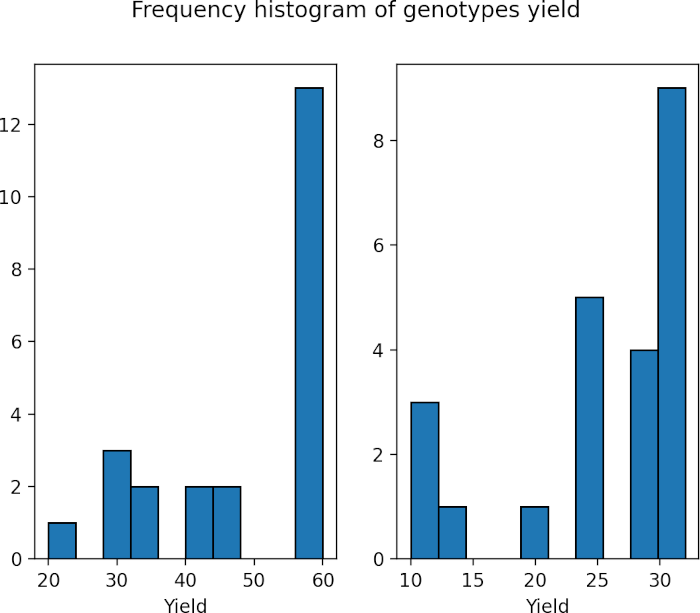
As the p value obtained from the Shapiro-Wilk test is significant (p < 0.05), we conclude that the data is not normally distributed. Further, in histogram data distribution shape does not look normal. Therefore, Mann-Whitney U test is more appropriate for analyzing two samples.
Perform Mann-Whitney U test
Perform two-sided (yield of two genotypes does not have equal medians) Mann-Whitney U test,
Note: We are comparing median as two genotypes have similar shape of distribution (see histogram and boxplot). If two groups do not have similar shape of distribution, you should compare mean ranks.
# SciPy v1.7.1
import scipy.stats as stats
# perform two-sided test. You can use 'greater' or 'less' for one-sided test
stats.mannwhitneyu(x=df['A'], y=df['B'], alternative = 'two-sided')
# output
MannwhitneyuResult(statistic=489.5, pvalue=7.004695394561267e-07)
Check online calculator for performing Mann-Whitney U test
Note: In the above example, the p value obtained from mannwhitneyu is based on the normal approximation as the sample size is large (n > 20). If the sample size is small, a normal approximation is not appropriate. To get exact p value, set method=”exact”. The
mannwhitneyufunction automatically calculates the exact p value when one of the sample size is < 8. Both exact and normal approximation p values should be roughly similar.
Mann-Whitney U test interpretation: As the p value obtained from the Mann-Whitney U test is significant (U = 489.5, p < 0.05), we conclude that the yield of the two genotypes significantly different from each other .
Perform one-sided (median yield of A genotype is greater than median yield of genotype B) Mann-Whitney U test,
import scipy.stats as stats
stats.mannwhitneyu(x=df['A'], y=df['B'], alternative = 'greater')
# output
MannwhitneyuResult(statistic=489.5, pvalue=3.5023476972806333e-07)
As the p value obtained from the Mann-Whitney U test is significant (U = 489.5, p < 0.05), we conclude that the yield of the A genotype significantly greater than the genotype B.
Learn how to perform Mann-Whitney U test in R
Related reading
References
- Nachar N. The Mann-Whitney U: A test for assessing whether two independent samples come from the same distribution. Tutorials in quantitative Methods for Psychology. 2008 Mar;4(1):13-20.
- Mann–Whitney Test
- Mann Whitney U Test (Wilcoxon Rank Sum Test)
If you have any questions, comments or recommendations, please email me at reneshbe@gmail.com
This work is licensed under a Creative Commons Attribution 4.0 International License

