Linux for Bioinformatics (for beginners)
Learn Linux command lines for Bioinformatics analysis
Learn Linux command lines for Bioinformatics analysis
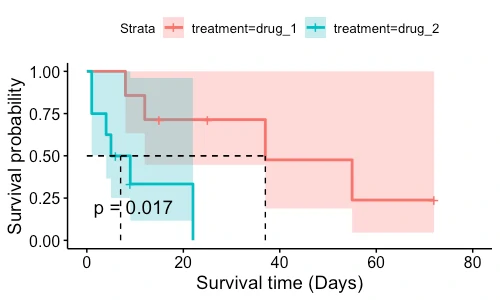
Detailed introduction of survival analysis and its calculations in R
Perform differential gene expression analysis of RNA-seq data using EdgeR
Perform differential gene expression analysis of RNA-seq data using DESeq2
Generate a gene counts matrix when featureCounts run separately on individual aligned files
SAMtools for manipulation of BAM files
NCBI E-utilities for downloading the single or large number of sequences from the NCBI sequence database
VCF fields information
bulk and single-cell RNA-seq expression units, count normalization, formula, examples in Python, gene quantification, batch effects, and between-sample and w...
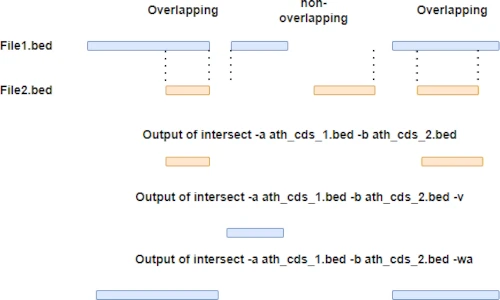
bedtools for comparative analysis of genomic datasets
Downloading FASTQ files from NCBI SRA database
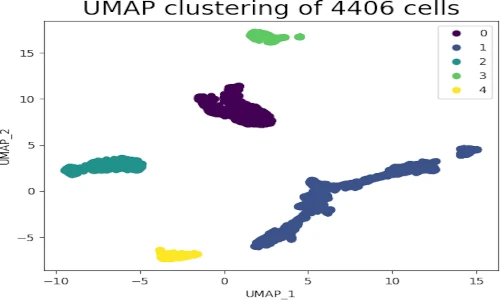
How to reduce and visualize high-dimensional data using UMAP in Python