What is Strandedness in RNA-seq?
RNA-seq strandedness and difference between stranded and non-stranded RNA-seq
RNA-seq strandedness and difference between stranded and non-stranded RNA-seq
Calculate descriptive statistics using describe() function from pandas DataFrame
describe() Function in R
learn how to use describe() function in R with several examples
Learn how to calculate trimmed mean in R with several examples
summary() Function in R: How to Use (With 6 Examples)?
How to use summary() function in R to get summarise the fitted model results
This tutorial explains how to use HISAT2 for aligning NGS reads to genome
lm in R
Extract R-Squared and adjusted R-Squared from lm summary statistics after fitting regression model
lm in R
Extract F Statistics and p value from lm summary statistics after fitting regression model
This article describes how to calculate the Variance Inflation Factor (VIF) to detect multicollinearity in R
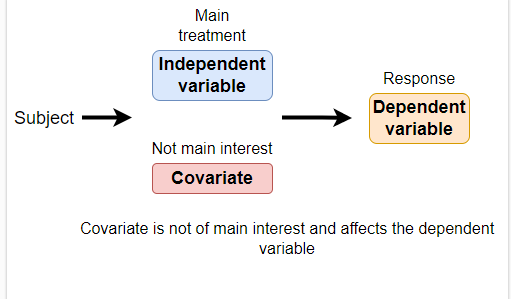
Explanation of covariate in statistics, covariate examples, and how to use covariate in statistical analysis
Complete tutorial on how to use STAR aligner in two-pass mode for mapping RNA-seq reads to genome
Learn how to align RNA-seq reads with STAR for accurate gene expression analysis in bioinformatics