How to perform one and two-sample t-test in Python
t-test
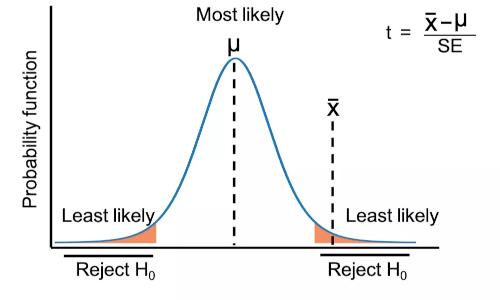
t-test (also known as Student’s t-test) is a parametric hypothesis testing method used for comparing the means between two different groups. In t-test, test statistic follows the t-distribution under the null hypothesis.
t-distribution is first proposed by William Sealy Gosset and published under the fictitious name of “Student” in Biometrika scientific journal. Hence, t-distribution is also known as Student’s t-distribution.
The t-test is specially developed for the small sample size data (n ≤ 30). However, if the sample size large, Z-test can also be used as t and z distributions are similar for larger sample size.
Based on group comparisons, t-test has three main types viz. One Sample t-test, two sample t-test (unpaired or independent), and paired t-test.
Types of t-test
One Sample t-test
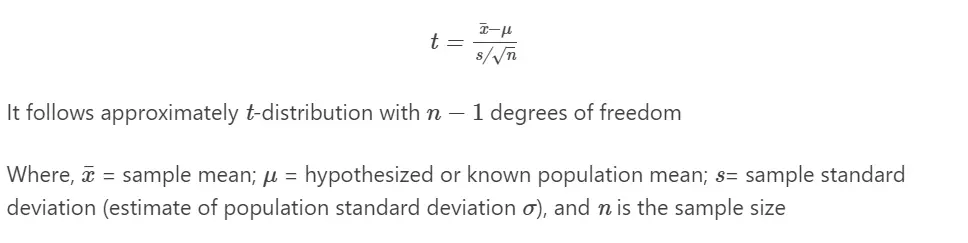
- One Sample t-test (single sample t-test) is used for comparing the sample mean (a random sample from a population) with the specific value (hypothesized or known mean of the population). In t-test, the population variance (σ2) is unknown and it is estimated from the sample variance (s).
- For example, a ball has a diameter of 5 cm and we want to check whether the average diameter of the ball from the random sample (e.g. 50 balls) picked from the production line differs from the known size.
Assumptions
- Dependent variable should have an approximately normal distribution (Shapiro-Wilks Test)
- Observations are independent of each other
- Dependent variable should be continuous
- Population variance (σ2) is unknown
Note: One sample t-test is relatively robust to the assumption of normality when the sample size is large (n ≥ 30)
Hypotheses
- Null hypothesis: Sample mean is equal to the hypothesized or known population mean
- Alternative hypothesis: Sample mean is not equal to the hypothesized or known population mean (two-tailed or two-sided)
- Alternative hypothesis: Sample mean is either greater or lesser to the hypothesized or known population mean (one-tailed or one-sided)
Learn more about hypothesis testing and interpretation
Formula
One Sample t-test formula,
Calculate one sample t-test in Python
To perform one sample t-test in Python, we will use the ttest_1samp() function available in Scipy package. In addition,
we will also use ttest() function from bioinfokit (v2.1.0 or later) packages for detailed statistical results. You can
install Scipy and bioinfokit packages using pip or conda.
In following example of one sample t-test uses the in-built data from bioinfokit package. If you have your own dataset, you can import it as pandas DataFrame
Perform one sample t-test using ttest_1samp() function in SciPy,
from scipy import stats as st
from bioinfokit.analys import get_data
# load dataset as pandas dataframe
df = get_data('t_one_samp').data
df.head(2)
# output
       size
0  5.739987
1  5.254042

# t test using scipy
a =  df['size'].to_numpy()
# use parameter "alternative" for two-sided or one-sided test
st.ttest_1samp(a=a, popmean=5)
# output
Ttest_1sampResult(statistic=0.36789006583267403, pvalue=0.714539654336473)
As you do not get detailed statistical output (such as confidence intervals, degrees of freedoms, sample size, etc.) from
ttest_1samp() function, we will Perform one sample t-test using ttest() function in bioinfokit,
from bioinfokit.analys import stat
res = stat()
res.ttest(df=df, test_type=1, res='size', mu=5)
print(res.summary)
# output
One Sample t-test

------------------  --------
Sample size         50
Mean                 5.05128
t                    0.36789
Df                  49
p value (one-tail)   0.35727
p value (two-tail)   0.71454
Lower 95.0%          4.77116
Upper 95.0%          5.3314
------------------  --------

# access t value and p value (two-tailed)
t, p = res.result[1], res.result[3]
t, p
# output
(0.36789006583267403, 0.714539654336473)
Interpretation
The p value obtained from the one sample t-test is not significant (p > 0.05), and therefore, we conclude that the average diameter of the balls in a random sample is equal to 5 cm.
Check how to perform one sample t-test from scratch
Two sample t-test (unpaired or independent t-test)
The two-sample (unpaired or independent) t-test compares the means of two independent groups, determining whether they are equal or significantly different. In two sample t-test, usually, we compute the sample means from two groups and derives the conclusion for the population’s means (unknown means) from which two groups are drawn.
For example, we have two different plant genotypes (genotype A and genotype B) and would like to compare if the yield of genotype A is significantly different from genotype B
Hypotheses
- Null hypothesis: Two group means are equal
- Alternative hypothesis: Two group means are different (two-tailed or two-sided)
- Alternative hypothesis: Mean of one group either greater or lesser than another group (one-tailed or one-sided)
Learn more about hypothesis testing and interpretation
Assumptions
- Observations in two groups have an approximately normal distribution (Shapiro-Wilks Test)
- Homogeneity of variances (variances are equal between treatment groups) (Levene or Bartlett Test)
- The two groups are sampled independently from each other from the same population
- Dependent variable should be continuous
- Population variances (σ1 and σ2) are unknown
Note: Two sample t-test is relatively robust to the assumption of normality and homogeneity of variances when sample size is large (n ≥ 30) and there are equal number of samples (n1 = n2) in both groups.
If the sample size small and does not follow the normal distribution, you should use non-parametric Mann-Whitney U test (Wilcoxon rank sum test)
Formula
Two sample (independent) t-test formula,
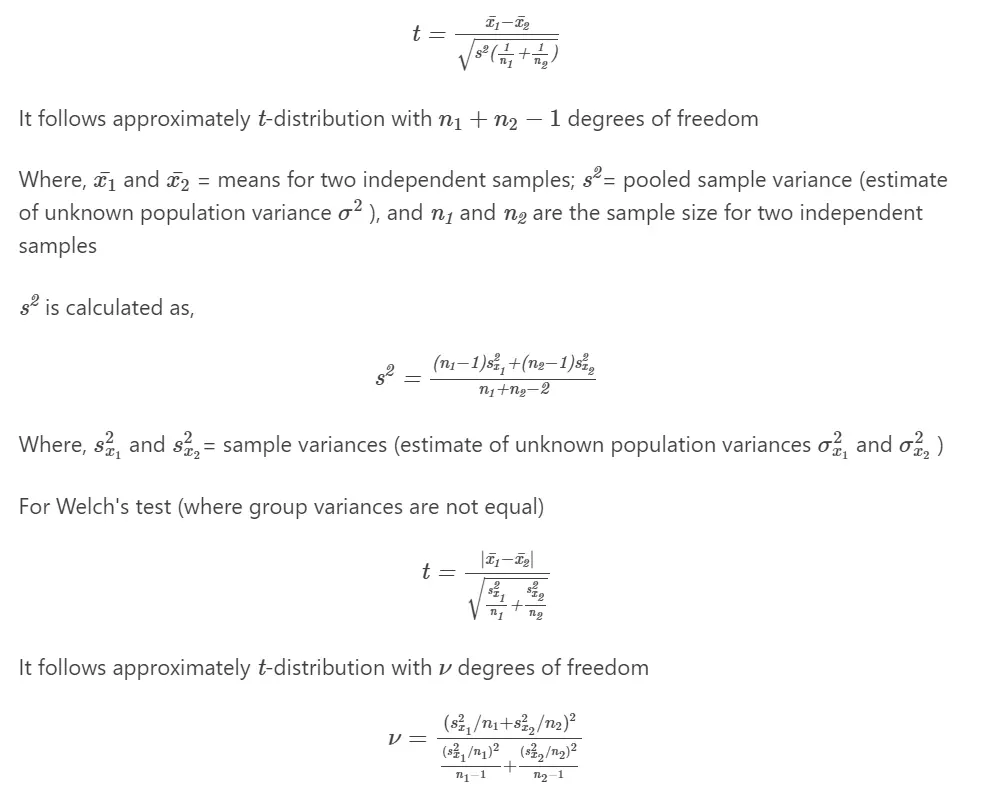
If the variances are equal, the two sample t-test and Welch’s test (unequal variance t-test) perform equally (in terms of type I error rate) and have similar power.
Calculate Two sample t-test in Python
- We will use
bioinfokit v2.1.0or later and Scipy (check how to install Python packages) - Download dataset for two sample and Welch’s t-test
Perform two sample t-test using SciPy,
from scipy import stats as st
from bioinfokit.analys import get_data
# load dataset as pandas dataframe
df = get_data('t_ind_samp').data
df.head(2)
# output
  Genotype  yield
0        A   78.0
1        A   84.3

a = df.loc[df['Genotype'] == 'A', 'yield'].to_numpy()
b = df.loc[df['Genotype'] == 'B', 'yield'].to_numpy()
st.ttest_ind(a=a, b=b, equal_var=True)
# output
Ttest_indResult(statistic=-5.407091104196024, pvalue=0.00029840786595462836)
Perform two sample t-test using bioinfokit,
from bioinfokit.analys import stat
res = stat()
# for unequal variance t-test (Welch's t-test) set evar=False
res.ttest(df=df, xfac="Genotype", res="yield", test_type=2)
print(res.summary)
# output
Two sample t-test with equal variance

------------------  -------------
Mean diff           -10.3
t                    -5.40709
Std Error             1.90491
df                   10
p value (one-tail)    0.000149204
p value (two-tail)    0.000298408
Lower 95.0%         -14.5444
Upper 95.0%          -6.05561
------------------  -------------

Parameter estimates

Level      Number    Mean    Std Dev    Std Error    Lower 95.0%    Upper 95.0%
-------  --------  ------  ---------  -----------  -------------  -------------
A               6    79.1    3.30817      1.35056        75.6283        82.5717
B               6    89.4    3.29059      1.34338        85.9467        92.8533

# access t value and p value (two-tailed)
t, p = res.result[1], res.result[3]
t, p
# output
(-5.407091104196024, 0.00029840786595462836)
Note: t-test can be performed on two groups with unequal sample sizes. But, to increase the power of the t-test, it is good to have an equal sample size in two groups.
Interpretation
The p value obtained from the t-test is significant (p < 0.05), and therefore, we conclude that the yield of genotype A is significantly different than genotype B.
Check how to perform two sample t-test from scratch
Paired t-test (dependent t-test)
- Paired t-test used to compare the differences between the pair of dependent variables for the same subject
- For example, we have plant variety A and would like to compare the yield of A before and after the application of some fertilizer
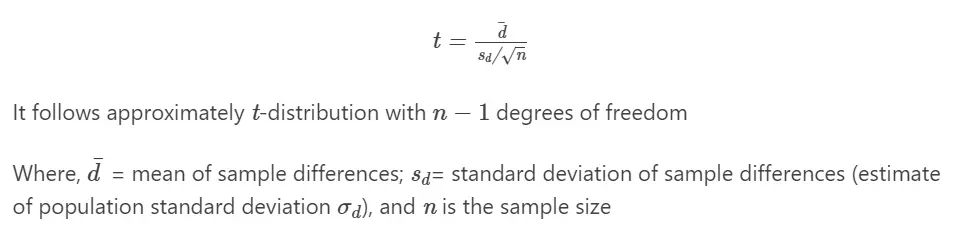
- Note: Paired t-test is a one sample t-test on the differences between the two dependent variables
Hypotheses
- Null hypothesis: There is no difference between the two dependent variables (difference=0)
- Alternative hypothesis: There is a difference between the two dependent variables (two-tailed or two-sided)
- Alternative hypothesis: Difference between two response variables either greater or lesser than zero (one-tailed or one-sided)
Assumptions
- Differences between the two dependent variables follows an approximately normal distribution (Shapiro-Wilks Test)
- Independent variable should have a pair of dependent variables
- Differences between the two dependent variables should not have outliers
- Observations are sampled independently from each other
- Dependent variable should be continuous
- Population variance (σd1) for difference is unknown
Formula
Paired t-test formula,
Perform Paired t-test,
from bioinfokit.analys import get_data, stat
# load dataset as pandas dataframe
# the dataset should not have missing (NaN) values. If it has, it will omitted
df = get_data('t_pair').data
df.head(2)
# output
      BF     AF
0  44.41  47.99
1  46.29  56.64

res = stat()
res.ttest(df=df, res=['AF', 'BF'], test_type=3)
print(res.summary)
# output
Paired t-test

------------------  ------------
Sample size         65
Difference Mean      5.55262
t                   14.2173
Df                  64
p value (one-tail)   8.87966e-22
p value (two-tail)   1.77593e-21
Lower 95.0%          4.7724
Upper 95.0%          6.33283
------------------  ------------

# access t value and p value (two-tailed)
t, p = res.result[1], res.result[3]
t, p
# output
(14.217347189987418, 1.775932404304854e-21)
Interpretation
The p value obtained from the t-test is significant (p < 0.05), and therefore, we conclude that the yield of plant variety A significantly increased by the application of fertilizer.
Check how to perform paired sample t-test from scratch
Note: If you have partially paired data, you can use an independent t-test by treating two dependent variables as two different samples or drop all unpaired observations for performing paired t-test. But, both ad hoc approaches are not appropriate as it does not follow the basic requirement and may lead to biased estimate of the variance and loss of information 6.
Sample size recommendations for t-test
- The t-test can be performed with a minimum sample size of 2. When using minimum sample size data, the effect size should be large and the data should follow the assumptions of a t-test. A larger sample size is always preferred over a smaller sample size.
- For paired t-test, it is advisable to have a high within-pair correlation (r > 0.8) to get a high statistical power (>80%) for small sample size data.
- t-test is relatively robust to the assumption of normality and homogeneity of variances when the sample size is large (n ≥ 30). If sample size is large, you can also consider performing Z-test.
Check how to perform t-test from scratch
Enhance your skills with courses on statistics
- Statistics with Python Specialization
- Advanced Statistics for Data Science Specialization
- Introduction to Statistics
- Python for Everybody Specialization
- Understanding Clinical Research: Behind the Statistics
- Inferential Statistics
References
- Virtanen P, Gommers R, Oliphant TE, Haberland M, Reddy T, Cournapeau D, Burovski E, Peterson P, Weckesser W, Bright J, van der Walt SJ. SciPy 1.0: fundamental algorithms for scientific computing in Python. Nature methods. 2020 Mar;17(3):261-72.
- Kim TK, Park JH. More about the basic assumptions of t-test: normality and sample size. Korean journal of anesthesiology. 2019 Aug;72(4):331.
- Schober P, Vetter TR. Two-sample unpaired t tests in medical research. Anesthesia & Analgesia. 2019 Oct 1;129(4):911.
- Zabell SL. On student’s 1908 article “the probable error of a mean”. Journal of the American Statistical Association. 2008 Mar 1;103(481):1-7.
- De Winter JC. Using the Student’s t-test with extremely small sample sizes. Practical Assessment, Research, and Evaluation. 2013;18(1):10.
- Guo B, Yuan Y. A comparative review of methods for comparing means using partially paired data. Statistical methods in medical research. 2017 Jun;26(3):1323-40.
- Ruxton GD. The unequal variance t-test is an underused alternative to Student’s t-test and the Mann–Whitney U test. Behavioral Ecology. 2006 Jul 1;17(4):688-90.
This work is licensed under a Creative Commons Attribution 4.0 International License
Some of the links on this page may be affiliate links, which means we may get an affiliate commission on a valid purchase. The retailer will pay the commission at no additional cost to you.

