Calculate Coverage From BAM File
Learn how to use samtools depth and coverage commands to calculate the coverage from BAM file
Learn how to use samtools depth and coverage commands to calculate the coverage from BAM file
Learn resons behind the Inf Value in VIF analysis in Python with example
Learn how to find the maximum and minimum sequence lengths in a FASTA file using Python, seqkit, and samtools
Learn how to use bedtools subtract to get non-overlapping portion between two regions in BED files
Learn what is log2 fold change, how to calculate log2 fold change, and why log2 transformation used for measuring the fold change between samples in bioinfo...
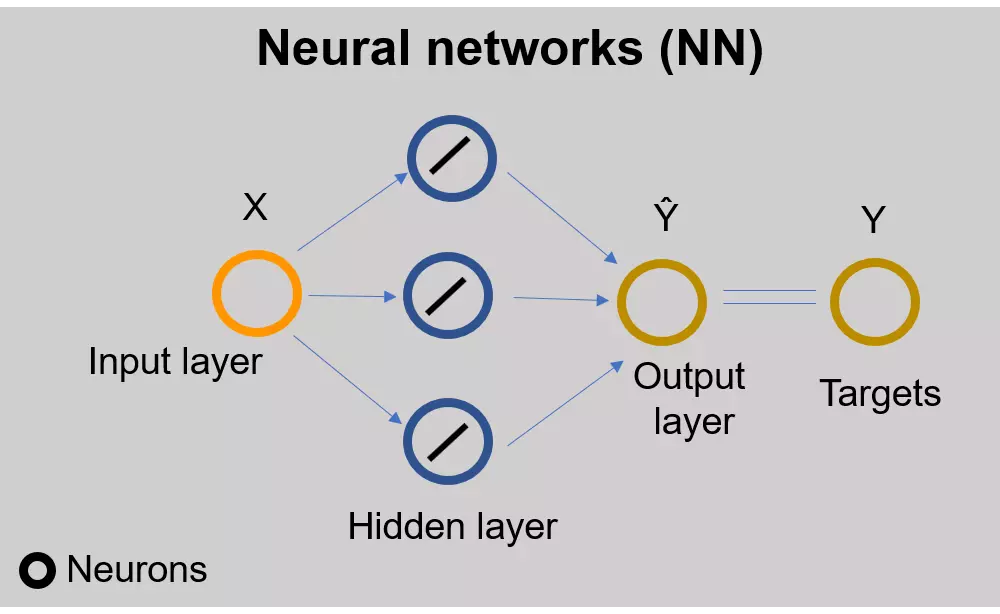
Introduction to 3D Genomics
Introduction to 3D Genomics
Learn how to extract reads from BAM files that fall within a specified region with samtools
Learn how to filter mapped and unmapped paired-end reads with Samtools
Learn how to filter mapped and unmapped sequence reads with Samtools
This tutorial explains what is singleton in bioinformatics
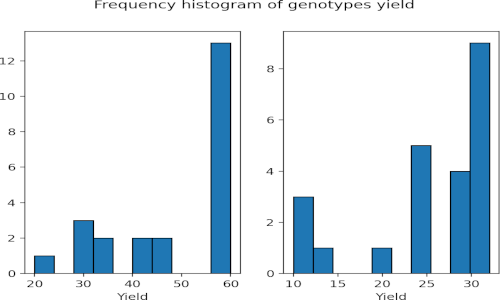
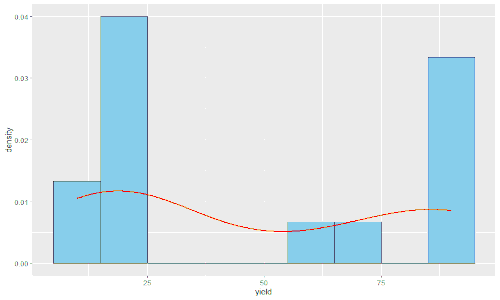
Learn how to Generate a histogram with NumPy
Learn how to calculate antilogarithms in R common and natural logarithms with practical examples
Learn how to calculate antilogarithms in Python common and natural logarithms with practical examples
Learn the key differences between quantiles and percentiles in Python
Learn the distinctions between quantiles, quartiles, and percentiles in statistics. Understand how these metrics divide and analyze data, providing insights ...
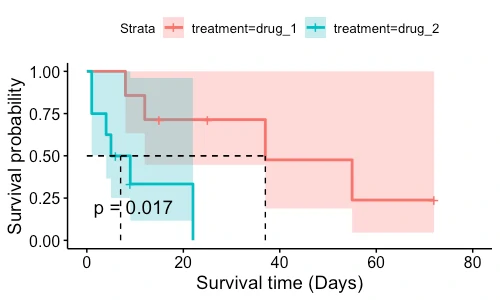
Learn how to visualize and analyze survival times, compare groups, and assess the impact of predictor variables using Kaplan-Meier curves in R
Learn how to create customized heatmaps using ComplexHeatmap in R
Learn how to calculate and visualize quartiles in R
random.uniform(): R runif() Equivalent Function in Python
Learn how to use random.uniform(): Python counterpart to R’s runif() function
Learn how to calculate quartiles in Python using NumPy and pandas
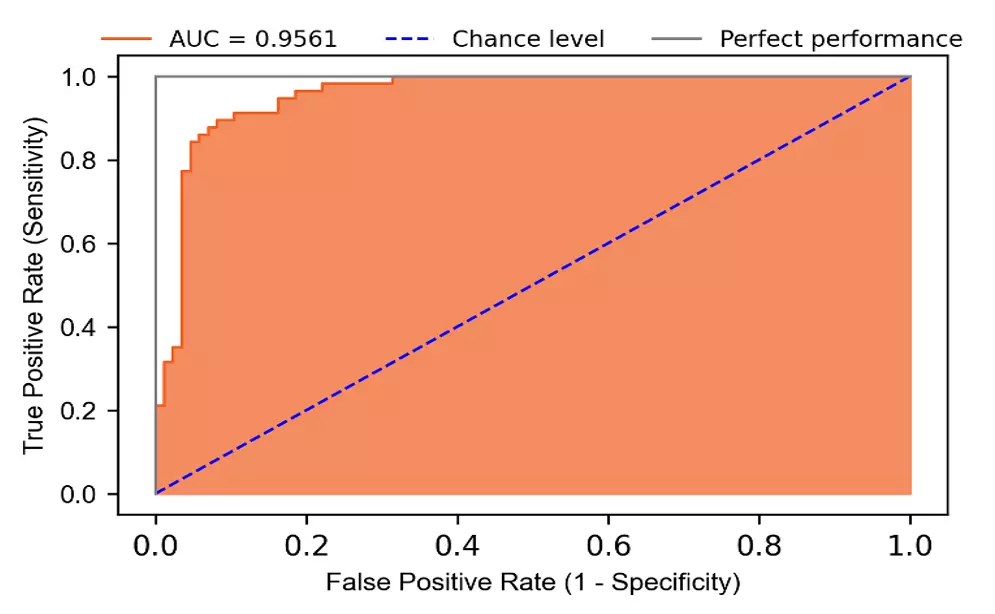
Learn how to compute AUC (Area Under the Curve) in Python for evaluating classification model performance
Learn how to compute AUC (Area Under the Curve) in R for evaluating classification model performance
Comprehensive guide to the two-sample Kolmogorov-Smirnov test in R
Learn how to plot ROC curve in R for model evaluation
Learn how to plot ROC curve in Python for model evaluation
Learn how to create a Q-Q plot in Python to assess the normal distribution of the data
Comprehensive guide to the One-sample Kolmogorov-Smirnov test in R
Learn how to generate random numbers from uniform distributions in R with the runif() function
Learn how to perform binary logistic regression in R and evaluate the model performance
Learn bedtools merge for combining overlapping and adjacent intervals in the BED file
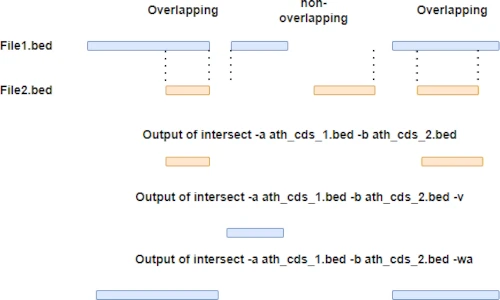
Learn bedtools intersect for finding overlapping and non-overlapping intervals between BED files in various ways
Calculate all DNA base combinations with Python code
Learn to perform the Shapiro-Wilk test for normality in R with step-by-step guidance and make sure the data meets the normality assumption for reliable stati...
Learn how to create a Q-Q plot in R to assess the normal distribution of the data
Learn how to conduct the Mann-Whitney U test in R for non-parametric group comparison
Learn the step-by-step process of Polymerase Chain Reaction (PCR)
Learn how to calculate primer melting temperature (Tm) for precise DNA amplification and molecular biology experiments
Three methods to calculate melting temperature (Tm) in R
Three methods to calculate melting temperature (Tm) in Python
Explore the significance of E-value, bit score, and p-value in BLAST alignments. Gain insights into how these parameters assess homology between biological s...
seqtk subseq to Extract Sequences from FASTA/FASTQ Files
Learn seqtk subseq function for extracting specific sequences and subsequences from a FASTA/FASTQ files
Convert Multi-line Fasta into Single-line Fasta using Python
Learn extract_seq() from bioinfokit function for extracting specific sequences and subsequences from a FASTA file
Learn how to count the number of columns in a CSV file using awk
blastp: Command-line Utility for Protein Sequence Search
Perform protein sequence similarity searches with the blastp command-line tool
blastn vs blastp: Which One You Should Use?
What is difference between blastn and blastp
blastn: Command-line Utility for Nucleotide Sequence Search
Perform Nucleotide sequence similarity searches with the blastn command-line tool
blastdbcmd to Extract Sequences from BLAST Database
blastdbcmd: A command-line tool for retrieving all or specific sequences from formatted BLAST databases
Get the reverse complement of a DNA sequence in a Python
Get the reverse complement of a DNA sequence in a one-liner Bash command using awk, tr, and rev
Creating a local BLAST database from FASTA file for faster, customized sequence similarity searches
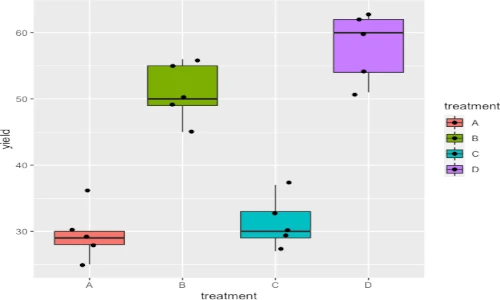
This article explains how to perform two-way ANOVA in R
This article explains how to perform one-way ANOVA in R
Learn what is Nextflow and how to use it for running bioinformatics pipeline
List of Bioinformatics tools to convert FASTQ file into FASTA format
Assemble PacBio and Nanopore long-reads using the Canu
IUPAC codes for representing nucleotide degeneracy
This article describes how to use the bedtools getfasta command to extract the sequence from the FASTA file based on the genomic coordinates given in the B...
Determine strandedness in RNA-seq using RSeQC quality control tool
RNA-seq strandedness and difference between stranded and non-stranded RNA-seq
Calculate descriptive statistics using describe() function from pandas DataFrame
describe() Function in R
learn how to use describe() function in R with several examples
Learn how to calculate trimmed mean in R with several examples
summary() Function in R: How to Use (With 6 Examples)?
How to use summary() function in R to get summarise the fitted model results
This tutorial explains how to use HISAT2 for aligning NGS reads to genome
lm in R
Extract R-Squared and adjusted R-Squared from lm summary statistics after fitting regression model
lm in R
Extract F Statistics and p value from lm summary statistics after fitting regression model
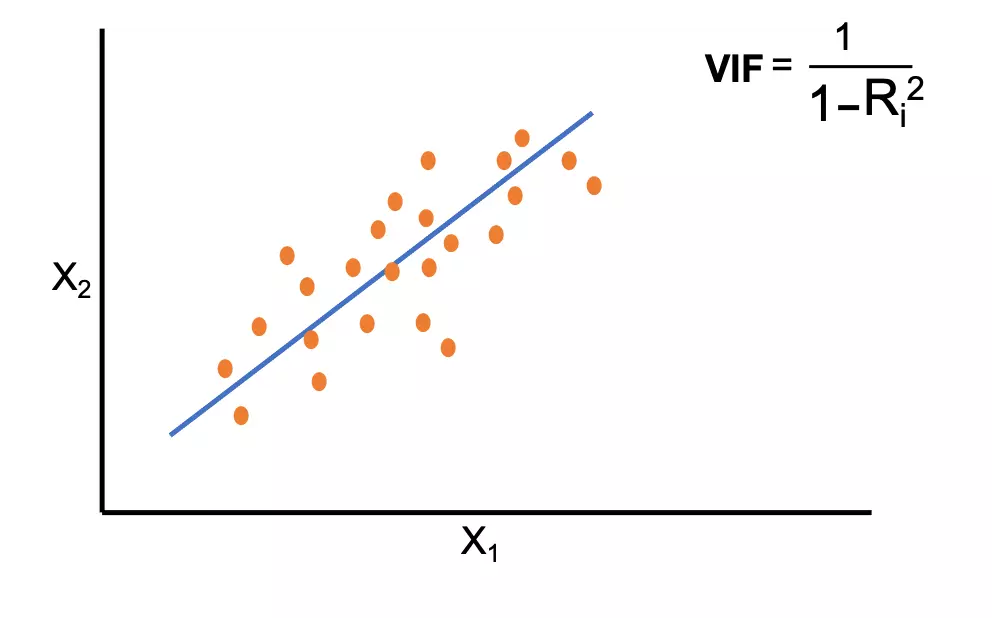
This article describes how to calculate the Variance Inflation Factor (VIF) to detect multicollinearity in R
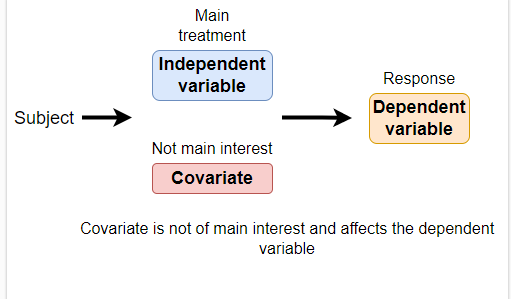
Explanation of covariate in statistics, covariate examples, and how to use covariate in statistical analysis
Complete tutorial on how to use STAR aligner in two-pass mode for mapping RNA-seq reads to genome
Learn how to align RNA-seq reads with STAR for accurate gene expression analysis in bioinformatics
Learn Linux command lines for Bioinformatics analysis
Detailed introduction of survival analysis and its calculations in R
Perform differential gene expression analysis of RNA-seq data using EdgeR
Perform differential gene expression analysis of RNA-seq data using DESeq2
Generate a gene counts matrix when featureCounts run separately on individual aligned files
SAMtools for manipulation of BAM files
NCBI E-utilities for downloading the single or large number of sequences from the NCBI sequence database
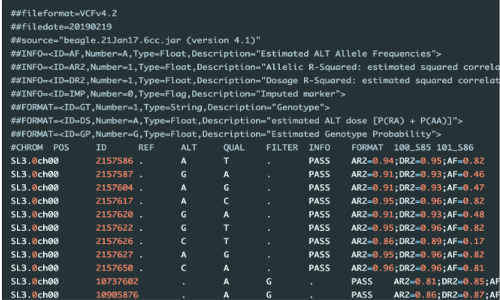
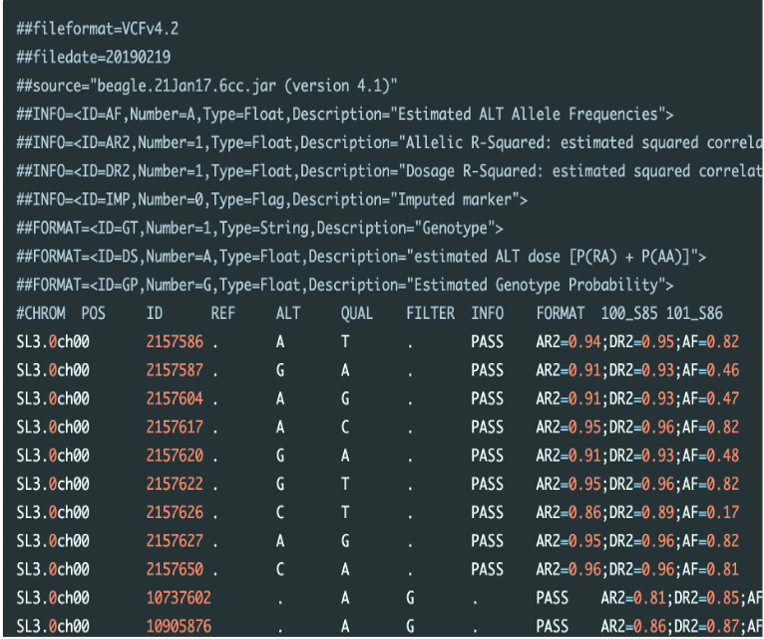
VCF fields information
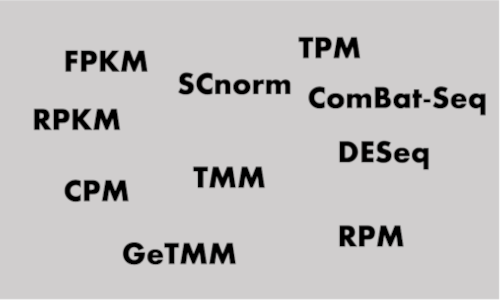
bulk and single-cell RNA-seq expression units, count normalization, formula, examples in Python, gene quantification, batch effects, and between-sample and w...
bedtools for comparative analysis of genomic datasets
Downloading FASTQ files from NCBI SRA database
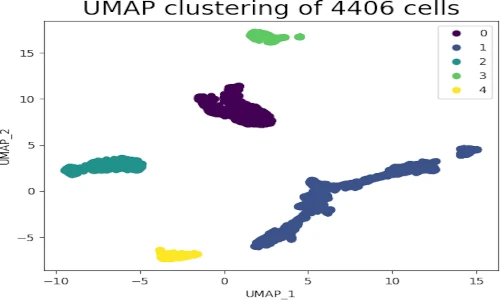
How to reduce and visualize high-dimensional data using UMAP in Python
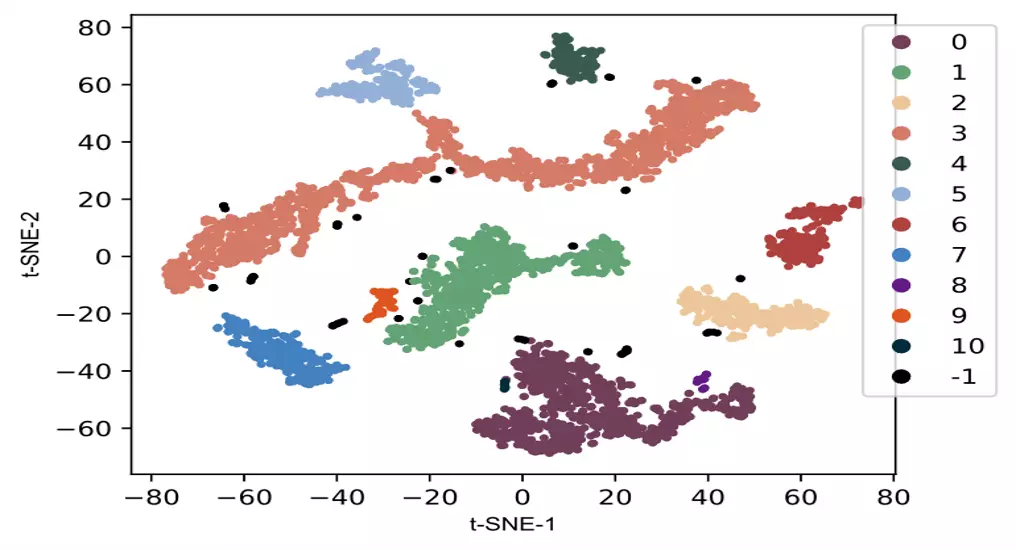
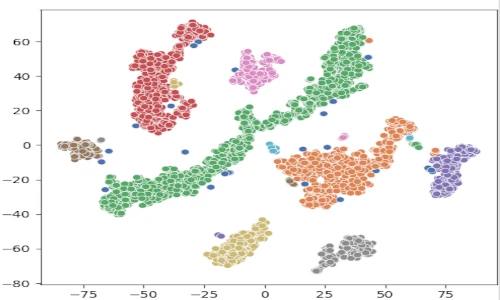
t-SNE using sklearn package. This article explains the basics of t-SNE, differences between t-SNE and PCA, example using scRNA-seq data, and results interpre...
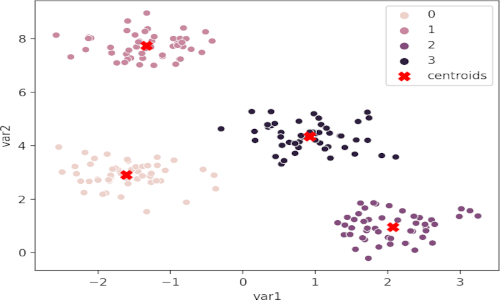
This article how to perform and visualize the K-means Clustering in Python
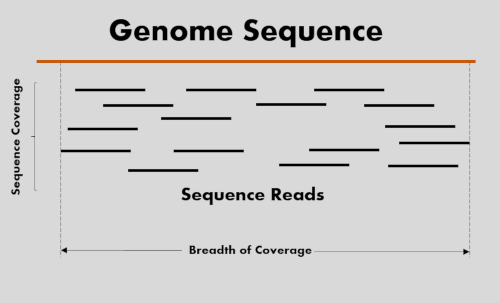
High-through sequencing coverage calculation and coverage recommendations
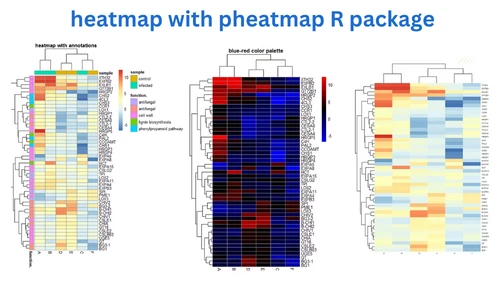
How to create and customize heatmap using pheatmap package in R
Visualize interactive heatmap using hvPlot and Bokeh
Heatmap and hierarchical clustering visualization in Python
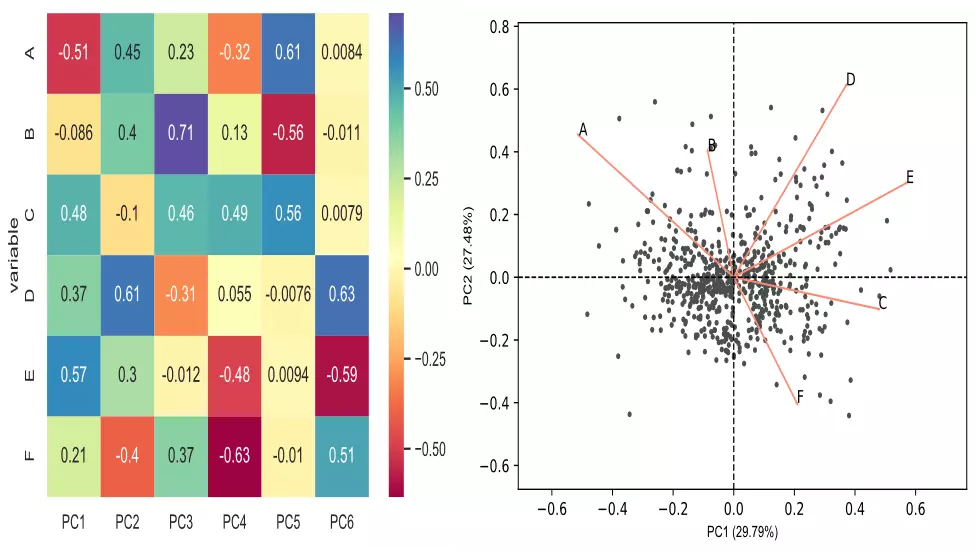
PCA using sklearn package. This article explains the basics of PCA, sample size requirement, data standardization, and interpretation of the PCA results
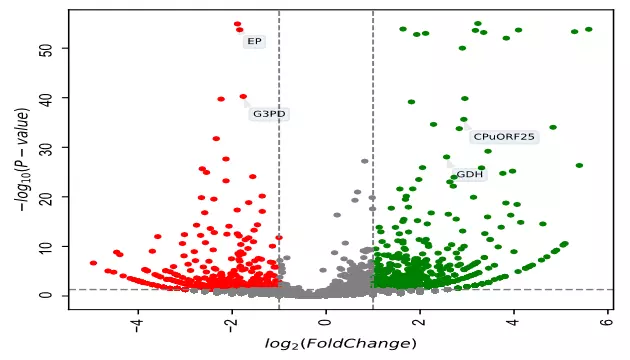
Volcano plot using bioinfokit package. This article explains the visualization of volcano plots for gene expression data
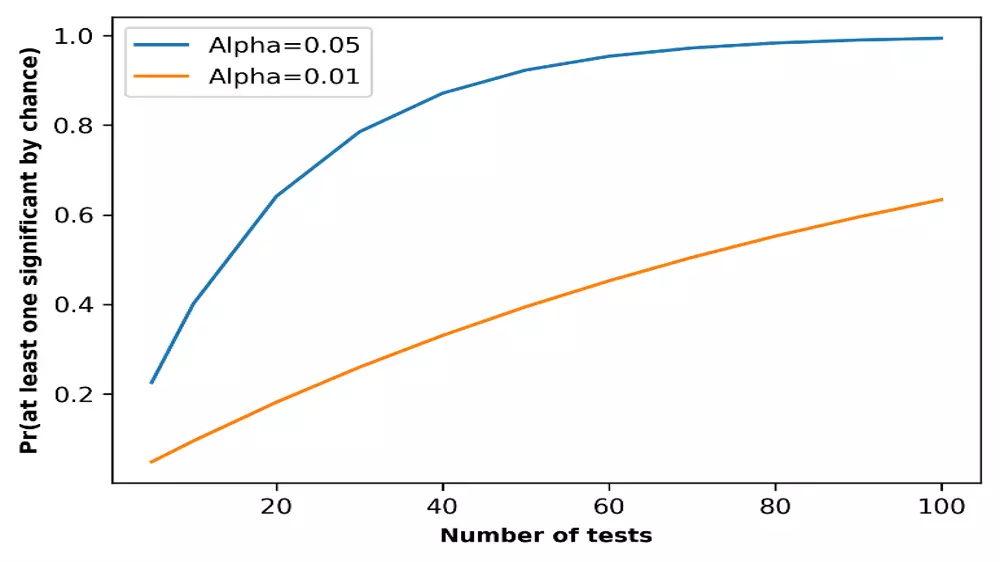
Multiple hypothesis testing and corrections, type I and II errors, false discovery rate, Bonferroni correction, and Benjamini/Hochberg correction
Biological data handling and processing using Python codes
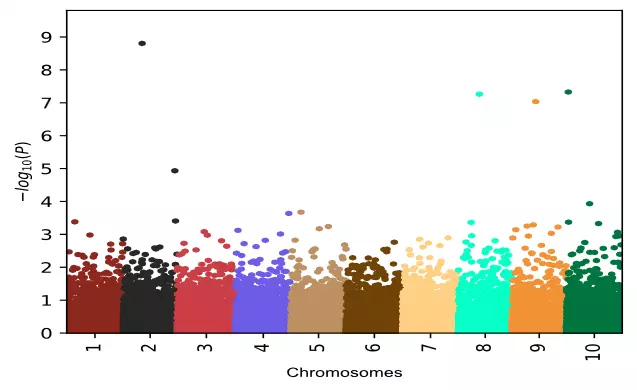
Introduction, analysis, and visualization of Manhattan plot in Python
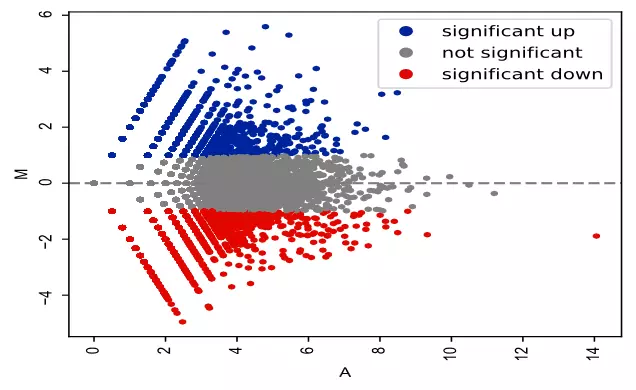
MA plot basics, analysis, and visualization
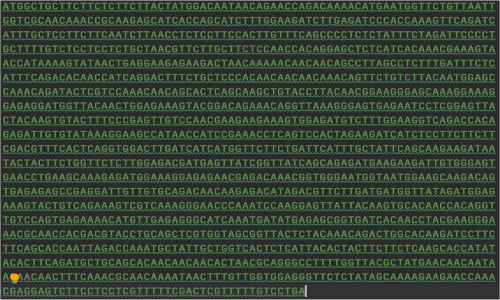
Split the nucleotide sequence into smaller sequences with defined size
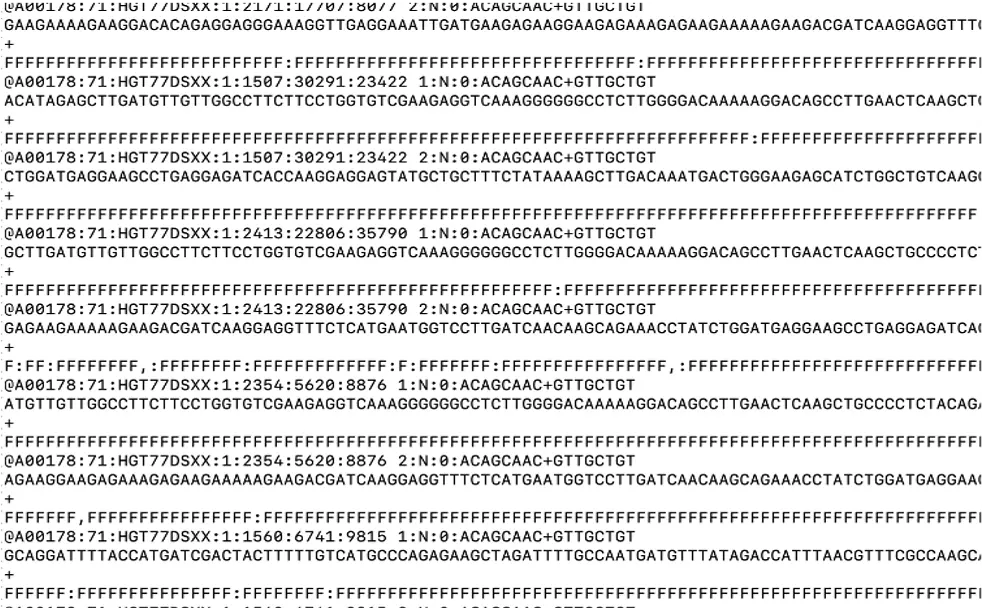
FASTQ sequence example, quality formats, and quality format detection
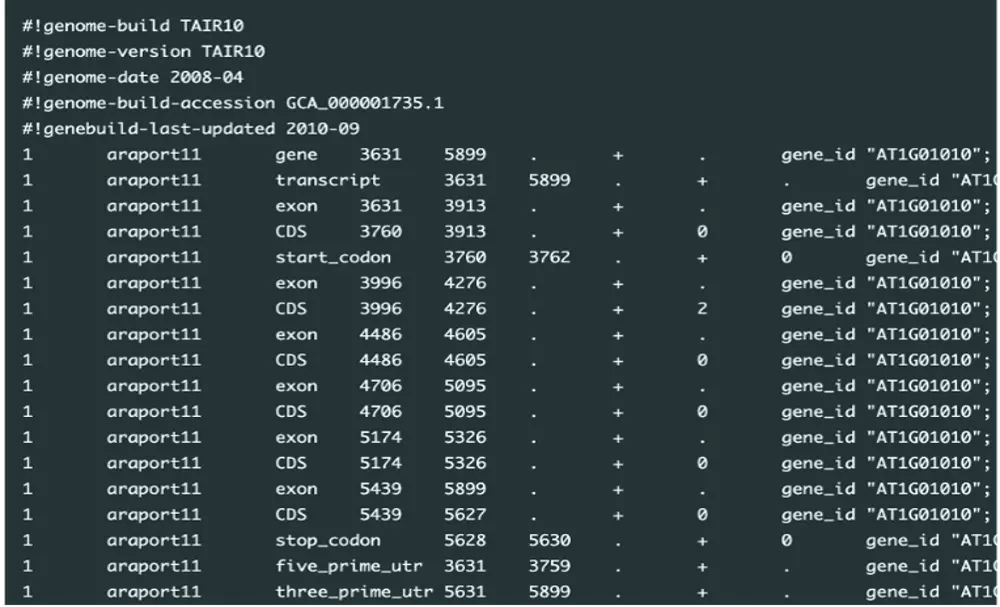
Introduction to GFF3 and GTF files, and their interconversions using Python code
GFF3 to GTF, HMM to CSV, TAB to CSV, and CSV to TAB
Genetic variant annotation for variant location in the genome, associated genes, and their gene functions
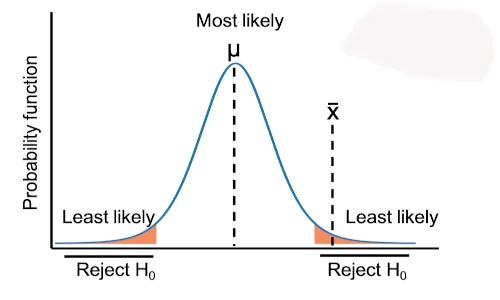
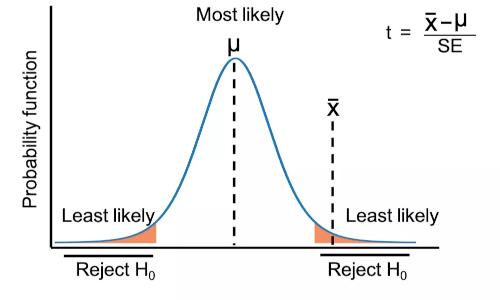
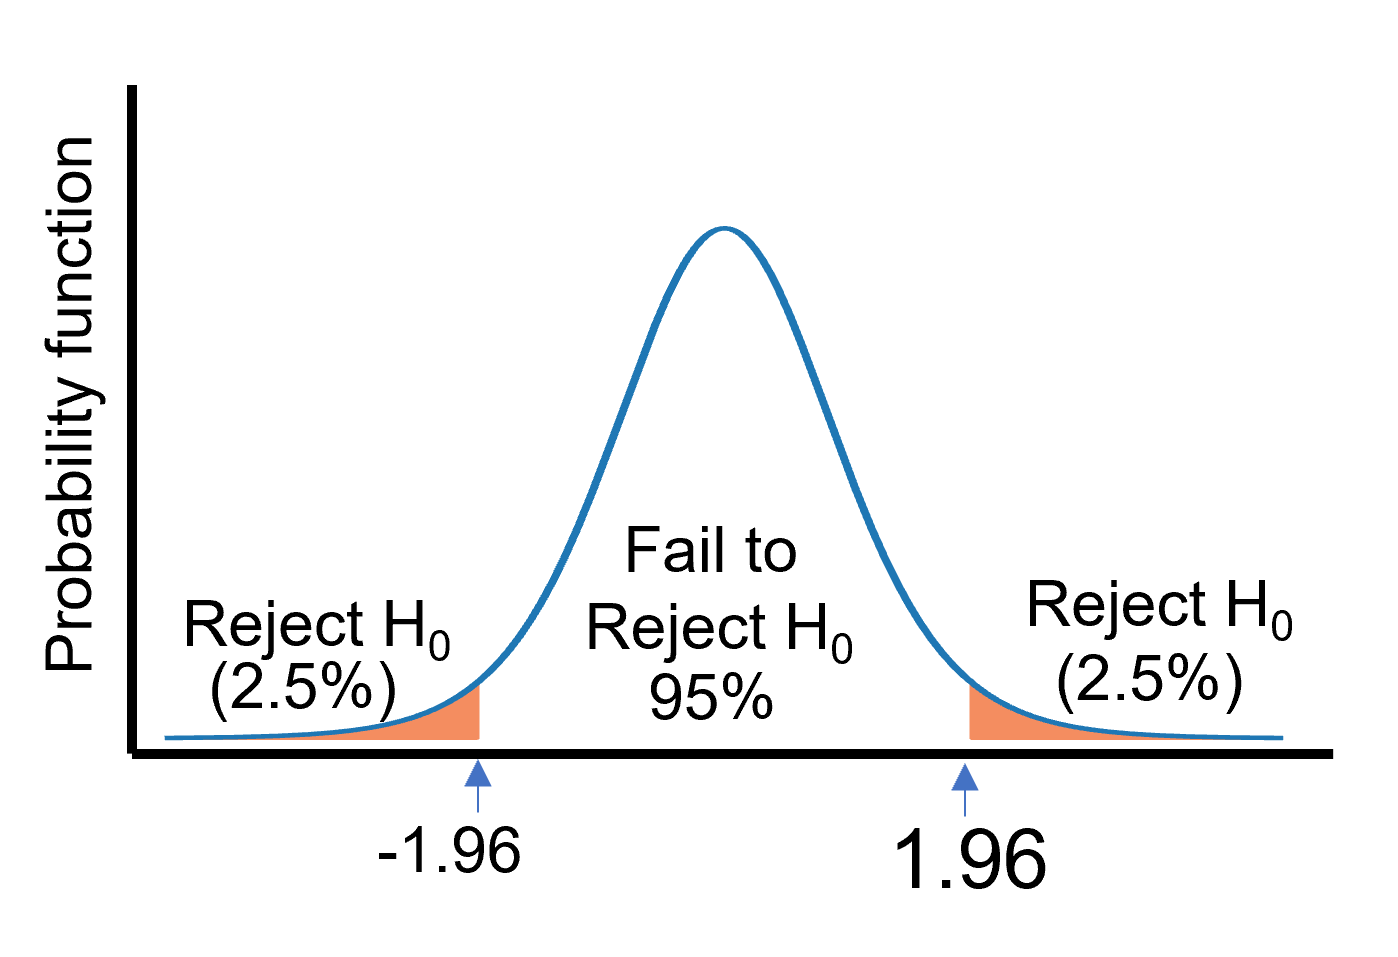
Learn how to propose null and Alternative hypotheses, perform the statistical analysis, and interpret the results
Learn how to read (import) a CSV in R
Solution for how to read a dataset with duplicated row names using read.csv() function
Learn how to query pandas DataFrame to select rows based on exact match, partial match, and conditional match in pandas DataFrame
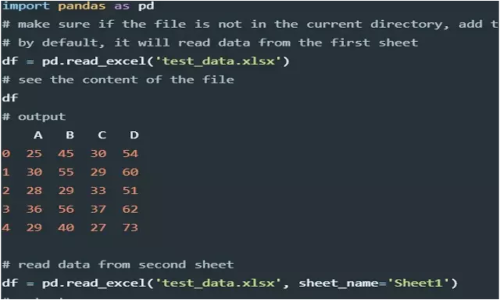
learn how to import CSV, Excel, Tab, JSON, and SQL files in pandas for data analysis and visualization
NaN) in pandas
Analyse and handle null or missing values in pandas series and dataframe
learn to join pandas dataframes in multiple ways
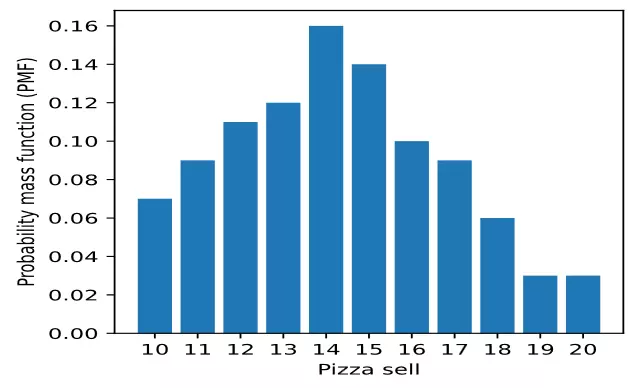
Learn how to use probability distributions, probability mass function (PMF), cumulative distribution function (CDF), and probability density function (PDF)
Logistic regression for prediction of breast cancer, assumptions, feature selection, model fitting, model accuracy, and interpretation
Learn how to create violin plots in Python (using seaborn and matplotlib package)
Learn how to split train and test datasets in Python using train_test_split() function from sklearn
pandas.DataFrame.plot.scatter)
This article explains how to create scatter plots using pandas DataFrame
pandas.DataFrame.plot.line)
Create single and multiple line plots from pandas DataFrame. Learn how to use pandas plotting functions for creating grouped line plots.
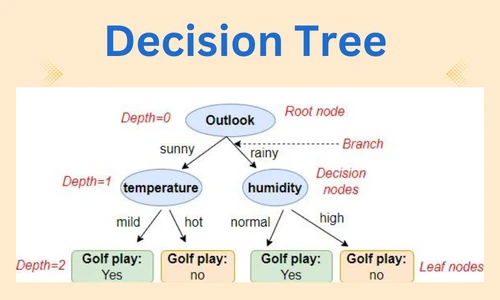
Detailed introduction to decision tree learning algorithms and how to construct a decision tree
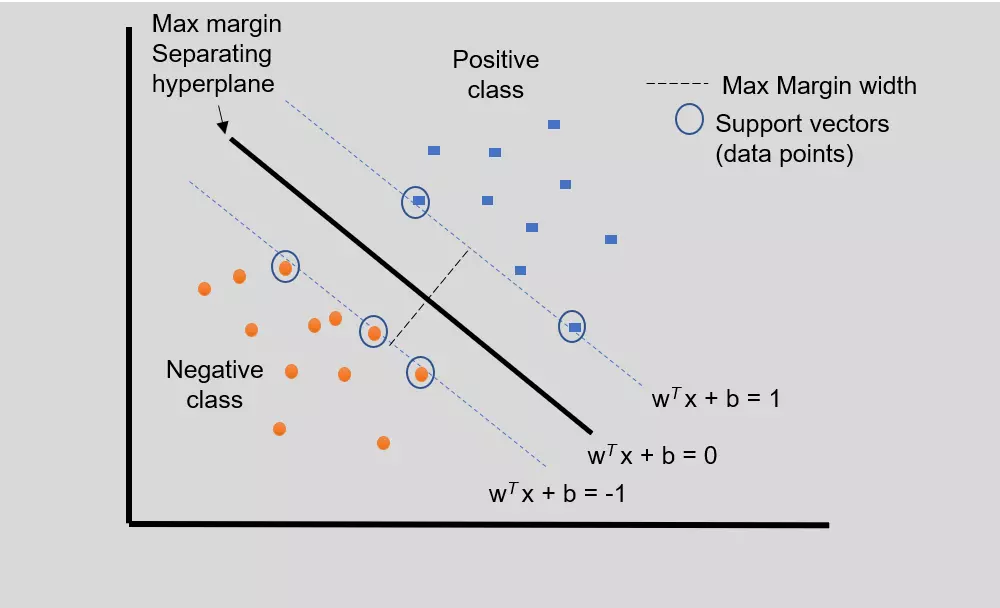
Implementation of Support vector machine (SVM) in Python for prediction of heart disease. Learn SVM basics, model fitting, model accuracy, and interpretation
pyplot.scatter)
Learn how to create 2D and 3D scatter plots from numerical arrays and pandas DataFrame using Python matplotlib package
Multicollinearity refers to the significant correlation among the independent variables in the regression model. Variance Inflation Factor (VIF) helps to dia...
Multiple regression analysis using statsmodels. Learn how to define regression model, assumptions, metrics evaluation, and interpretation
Linear regression using PyTorch
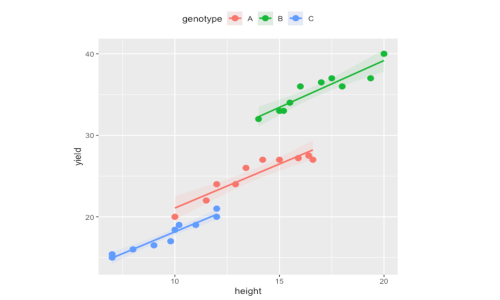
This article explains background of the linear regression and how to perform a linear regression with a Python code.
Learn to calculate residuals in regression analysis manually and with Python and R codes
Learn the basics of DBSCAN and implement DBSCAN clustering in Python
This article explains how to select rows, columns, and a subset of pandas DataFrame using various indexing operations and pandas functions
What is pandas?
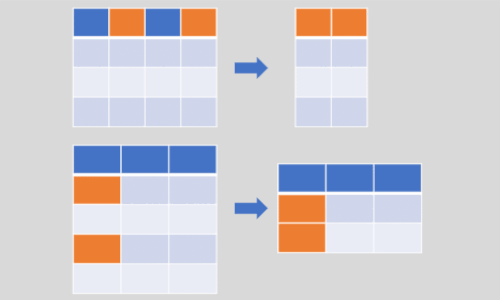
Learn four methods to replace the column values in pandas DataFrame based on column conditions
Learn how to convert pandas DataFrame from wide to long format using melt() function
Group dataframe rows into a list based on a common element from one column
Learn how to split the strings as an int list in Python
Learn how to setup a passwordless login to remote SSH server
Learn how to multiply single or multiple columns in a pandas DataFrame
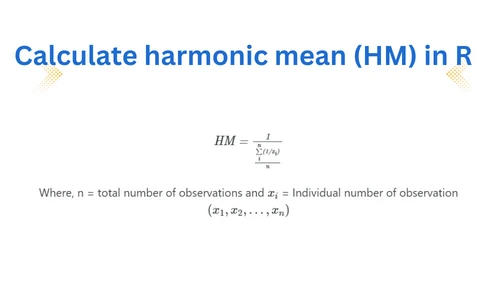
Learn what is harmonic mean and how to calculate it in R
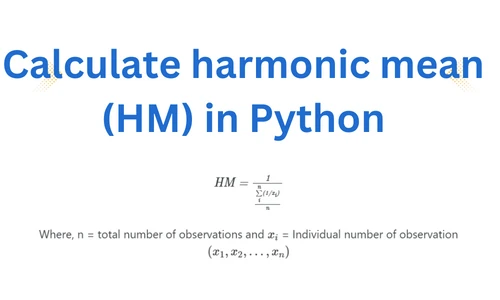
Learn what is harmonic mean and how to calculate it in Python
Learn how to generate a random dataset with normal distribution using NumPy
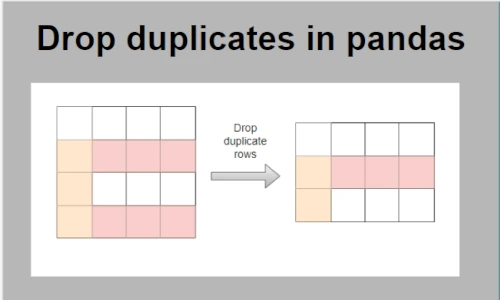
Learn how to identify and drop duplicates in a pandas DataFrame
Learn how to create and sort Python dictionary by key and value
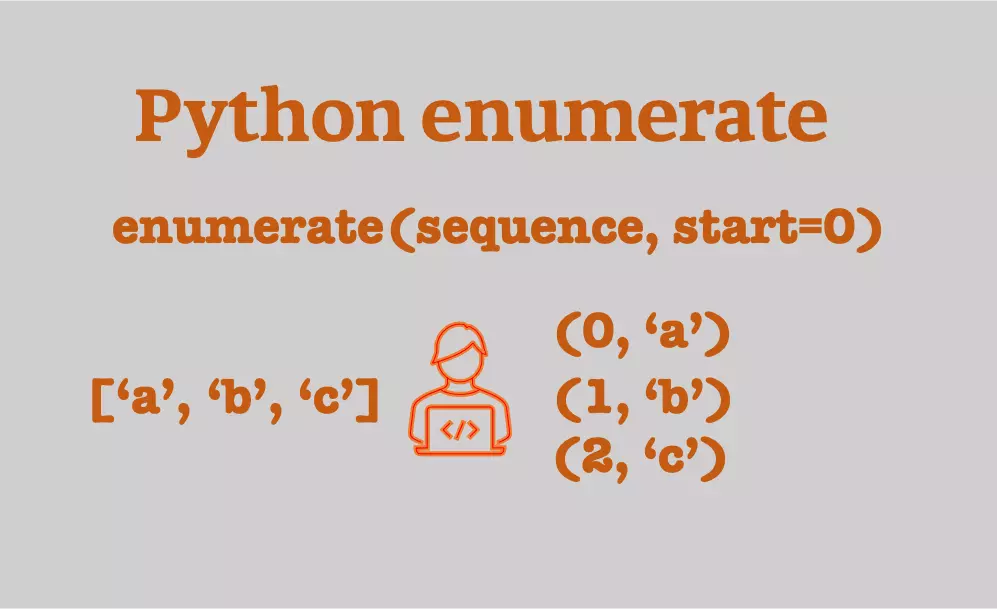
Python enumerate built-in function allows iterating over list and dictionary and helps to access its items along with index values
Learn how to obtain keys from dictionary in Python
Learn how to count strings in Python
Learn various ways to add rows to the Pandas DataFrame
Python tuples initialization and operations
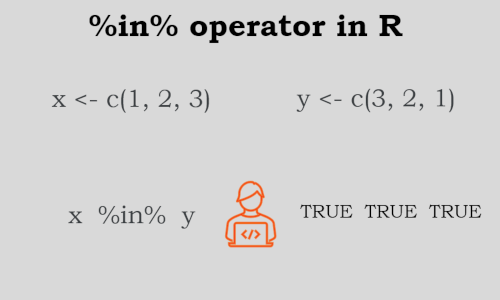
%in% and %notin% operators in R (with examples)
Learn how to use %in% operator in R
$ operator in Data Frame and list in R (with six examples)
Learn how to use $ operators in R to work with Data Frame and list
Learn different methods to get column names from pandas DataFrame
Learn to subset or filter Data Frames in R
Learn to reorder columns by name and index in R Data Frame
Learn different methods to rename single and multiple column names in pandas DataFrame
Learn how to get last any number of characters of the strings in Python
Learn how to split the value in pandas DataFrame column and create new columns
Learn how to get remove any number of characters of the strings in Python
Learn when to use and how to calculate Chi-squared test for independence
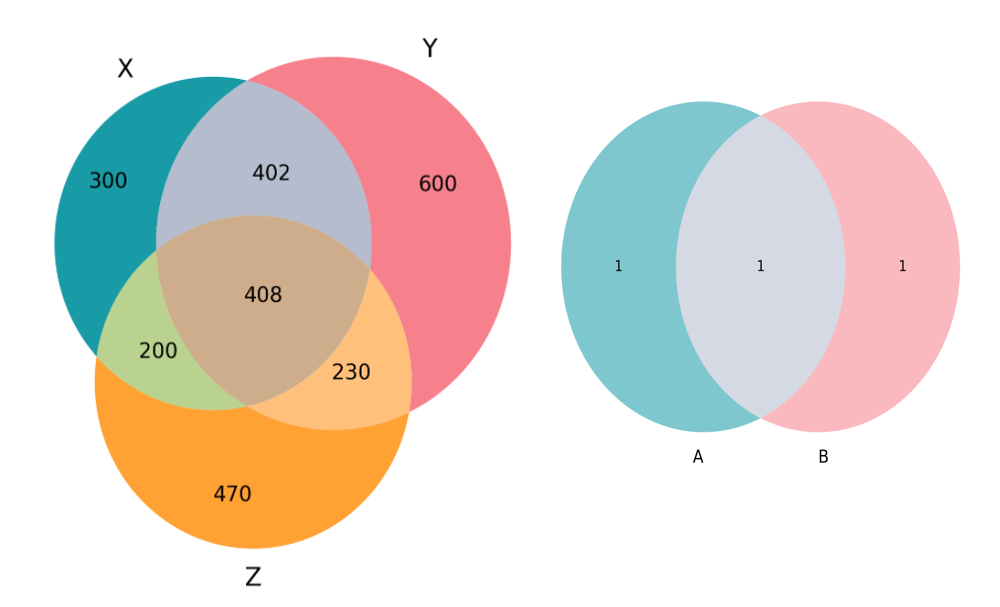
Create two and three-way Venn diagrams in Python and R
Learn when to use Z-test, types of Z-test, assumptions, hypothesis, and formula for each type of test, and Z-test calculation in R
Learn how to perform one sample, two samples, and paired Z-test in Python. This article also covers when to use Z-test, types of Z-test, assumptions, hypothe...
Learn when to use t-test, types of t-test, assumptions, hypothesis, and formula for each type of test, and t-test calculation in Python
Learn to perform sample proportions Z-Test in R
Learn when to use Mann-Whitney U test, assumptions, hypothesis, and formula, and test calculation in Python
Calculate Mann-Whitney U test online calculator
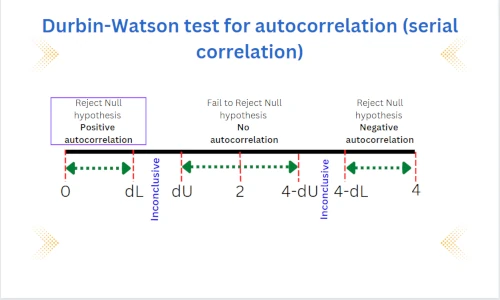
Find out how to detect autocorrelation in your data using the Durbin-Watson test in R. Get a step-by-step guide on how to run this test.
Learn to perform Durbin-Watson test (a test for autocorrelation) in Python
Calculate three types of t-test from scratch
Learn Conduct Fisher exact test in R for categorical data associations
A step-by-step article for performing Fisher’s exact test in Python
Online calculator for Fisher’s exact test of independence for 2 x 2 contingency table
Reverse complementary of DNA sequences
What is VCF file? VCF stands for variant call format It is a text file (file extension as .vcf) storing meta-information, marker and genotype data of ge...
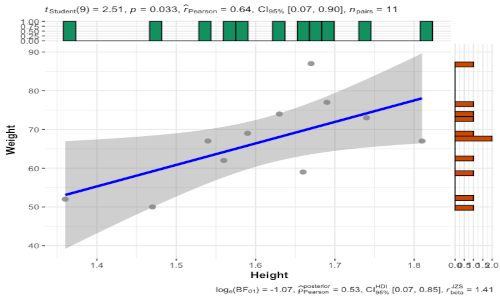
This articles explains Pearson’s, Spearman’s rho, and Kendall’s Tau correlation methods and their calculation in R
Correlation analysis using Python code
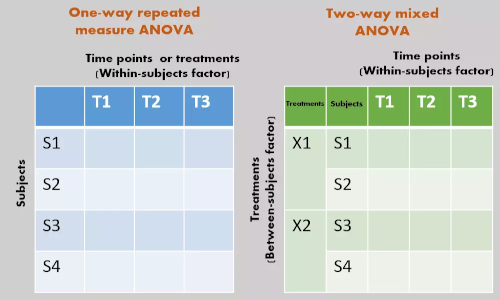
Repeated Measure ANOVA in Python and R. This article explains repeated Measure ANOVA model, multiple pairwise comparisons, and results interpretation
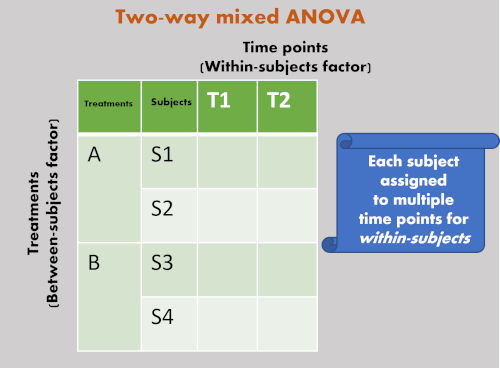
Learn to perform mixed ANOVA, check assumptions, and post-hoc tests for significant interactions and main effects
Kruskal-Wallis test is a non-parametric test for estimating the differences between multiple groups. Learn the basics of Kruskal-Wallis test, its underlying ...
Learn how to conduct one-way and two-way ANOVA tests, interpret results, and make informed statistical decisions using Python
Learn how to install, upgrade, and check versions of Python packages
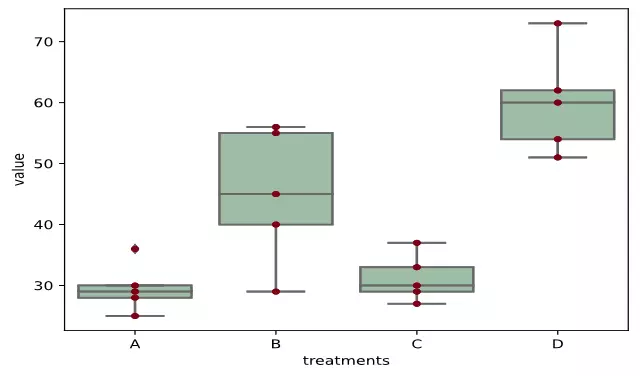
Learn how to conduct Multivariate Analysis of Variance (MANOVA) in R with step-by-step guidance
A step-by-step article for performing Friedman test in R
A step-by-step article for performing Friedman test in Python
A step-by-step article for performing ANCOVA in R and Python. This article describes the background of ANCOVA, assumptions, hypotheses, and codes for perform...
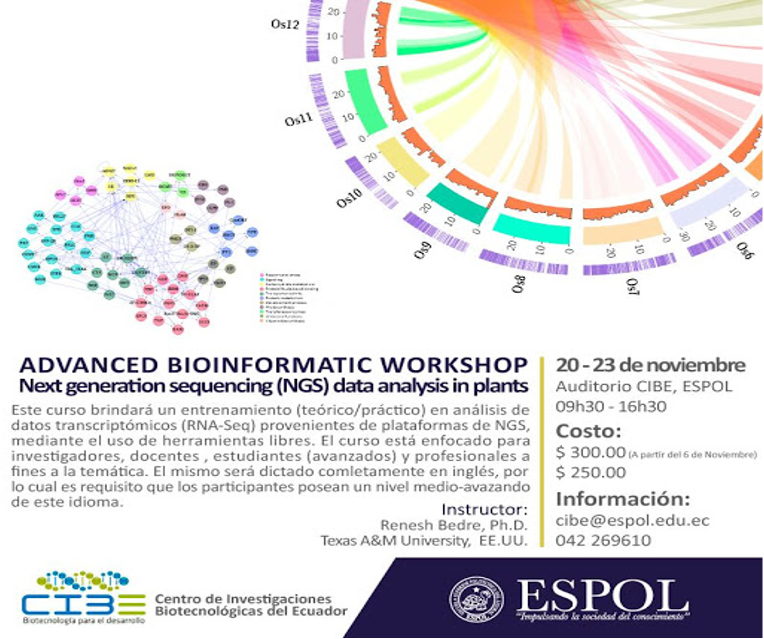
Title: Advanced Bioinformatics Workshop
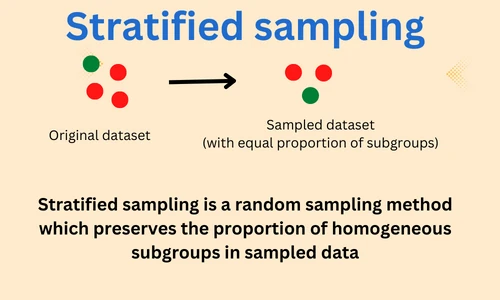
Learn how to perform stratified sampling in Python
Learn how to perform random sampling with and without replacement and example in Python
Variable types Flowchart for types of variables used for collecting and analyzing the data
Code for performing MANOVA in Python
Learn the differences between manipulated, response, and control variable. Manipulated (also known as independent) variable can be changed in the experiment ...
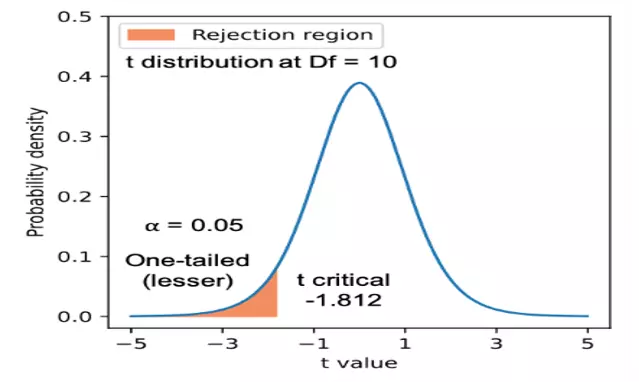
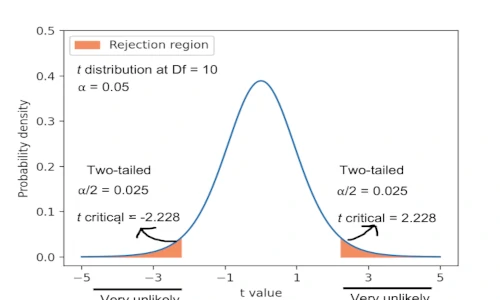
Learn how to calculate p-values by hand (using t test example) to gain a deeper understanding of statistical hypothesis testing.
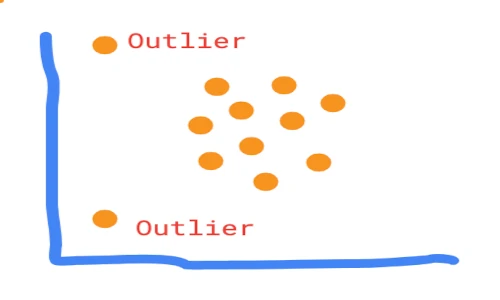
Learn how to detect outlier in the dataset using visual and statistical methods
Learn how to perform Brown-Forsythe test for equality of variances in R
Learn how to perform Brown-Forsythe test for equality of means in R
This article explains how to perform the one-way ANCOVA in Python. You can refer to this article to know more about ANCOVA, when to use ANCOVA, assumptions, ...